


What Did You Expect?
Climate Fueled Extreme Weather, Part 6

This is Part 6 in the THB series — Climate Fueled Extreme Weather. You can find Part 1 here, Part 2 here, Part 3 here, Part 4 here, and Part 5 here. Each can be read on their own, but I encourage you to start from the beginning as each installment draws on the ones before. If you have made it this far that you know that there is a massive gap between what you see in the media and what you find in the IPCC. Below, Part 6 shows just how large that gap is.
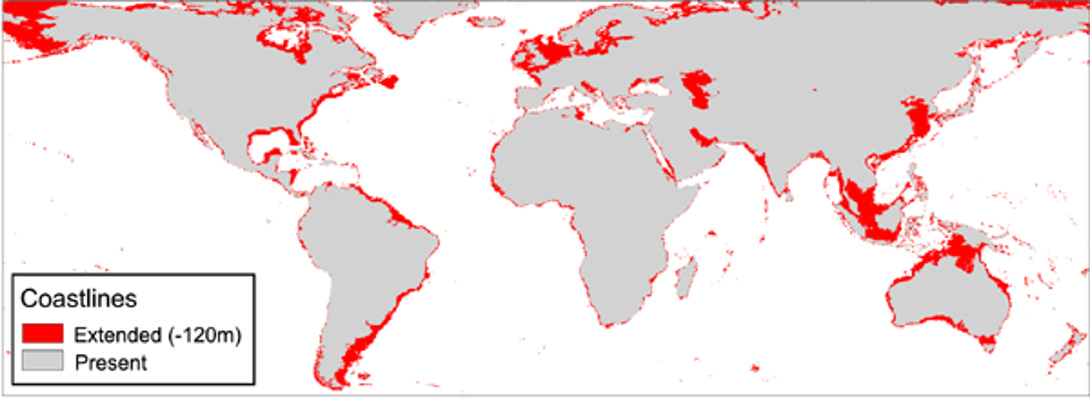
About 20,000 years ago, the world was in an ice age. The era is called the Last Glacial Maximum and had global sea levels more than 120 meters (~400 feet) lower than they are today, according to the Intergovernmental Panel on Climate Change (IPCC). There was no North Sea, English Channel, or Persian Gulf, and Australia and New Guinea were part of the same continent, as you can see in the image above.
Although the world has changed a lot since then, we do not say that storm surges from hurricanes are 400 feet higher than they used to be — that wouldn’t make any sense. What we typically care care about, practically, is change on human time scales of years and decades.
“The 2023 temperature anomaly has come out of the blue, revealing an unprecedented knowledge gap perhaps for the first time since about 40 years ago... We don’t have a quantitative explanation for even half of it. That is pretty humbling” Gavin Schmidt, NASA, 15 Aug 2024
Wisely, the IPCC uses several baseline periods1 from which to assess observed climate changes and to project future changes in climate. The IPCC explains:
Baseline refers to a period against which anomalies (i.e., differences from the average value for the baseline period) are calculated. Examples include the 1750 baseline (used for anthropogenic radiative forcings), the 1850–1900 baseline (an approximation for pre-industrial global surface temperature from which global warming levels are calculated) and the 1995–2014 baseline (used for many climate model projections). A reference period indicates a time period over which various statistics are calculated (e.g., the near-term reference period, 2021–2040).
Most of us will care more about future changes from the recent 1995-2014 baseline, rather than from 1850-1900 or 20,000 years ago.
The importance of baselines for expected change came to mind over the weekend when I came across this unvarnished misinformation from an oft-quoted climate scientist:
“The damaging impacts of climate change, and in particular from more extreme weather events, such as wildfires, floods, heatwaves, more intense hurricanes, are actually in many respects exceeding the predictions made just a decade ago.”
If you have read the first five parts of this series, then you will easily spot the multiple false claims here:
Ten years is not nearly long enough to detect and attribute damaging impacts from changes in climate, or even to simply detect changes in climate;
On any time scale, the IPCC has not detected or attributed changes in wildfires,2 floods, or hurricanes (it has for heatwaves, over many decades);
We can add to the list of false claims here that the climate community does not issue decadal predictions or projections for wildfires, floods, heatwaves, hurricanes, or any other extreme events, much less for their impacts.
In Part 3 of this series, I reviewed what the IPCC concluded about the emergence of the signal of projected changes in the incidence of extreme weather — tl;dr = detection with high confidence is not expected to occur this century for most extreme weather phenomena.
Today, I summarize what the IPCC concludes about how major modes of climate and climate variability are projected to change in the near term, defined as change from the baseline period of 1995-2014 to 2021-2040.
My summary below relies on IPCC AR6 Chapter 4 — an excellent and little-noticed part of the IPCC Working Group 1 report. As with much of that report, I expect most readers will be surprised by what the IPCC actually says, as compared to what we hear from campaigning scientists and journalists.
I summarize the IPCC findings for each of Chapter 4’s subsections assessing “near term” change, and after that I discuss. Let’s go . . .
Global Surface Average Temperature (GSAT)
Near-term (2021–2040) GSAT changes relative to 1995–2014 exhibit only minor dependence on SSP scenario, consistent with AR5 (Table 4.5). Averaged over the twenty years of the near term and across all scenarios, GSAT is very likely to be higher than over 1995–2014 by 0.4°C–1.0°C.
Spatial Patterns of Surface Warming
Internal variability in near-surface temperature change is large in many regions, particularly in mid-latitudes and polar regions (Hawkins and Sutton, 2012). Projections from individual realizations can therefore exhibit divergent regional responses in the near-term in areas where the amplitude of a forced signal is relatively small compared to internal variability.
Precipitation
The ‘wet get wetter, dry get drier’ paradigm, which has been used to explain the global precipitation pattern responding to global warming (Held and Soden, 2006), might not hold, especially over subtropical land regions . . . Near-term projected changes in precipitation are uncertain mainly because of natural internal variability, model uncertainty, and uncertainty in natural and anthropogenic aerosol forcing (medium confidence).
Global Monsoon Precipitation and Circulation
In summary, we assess that near-term changes in global monsoon precipitation and circulation will be affected by the combined effects of model uncertainty and internal variability, such as AMV and PDV, which together are larger than the forced signal (medium confidence).
Arctic Sea Ice
Based on results from CMIP6 models, we conclude that Arctic SIA [sea ice area] will decrease in September in the near term (Figure 4.15, high confidence).
Ocean and Land Carbon Flux
In summary, it is likely that ocean carbon flux will increase in the near term under the higher emissions scenarios [SSP5-8.5, SSP3-7.0], while a large component of terrestrial variability makes it is unlikely that an increase in land carbon flux will be detected over this period.
Northern Annular Mode (NAM)
Considering these new results since AR5, in the near-term it is likely that any anthropogenic forced signal in the NAM will be of comparable magnitude or smaller than natural internal variability in the NAM (medium confidence).
Southern Annular Mode (SAM)
In all seasons, the differences between the central estimates of the change in the SAM index for each SSP are much smaller than the inter-model ensemble spread.
El Niño–Southern Oscillation (ENSO)
There are no distinguishable changes in the rainfall variability among five SSPs with significant model spread in the near term. Hence, no robust change in amplitude of ENSO SST and rainfall variability is expected in the near term although the rainfall variability slightly increases.
Indian Ocean Basin and Dipole Modes (IOB, IOD)
There is no robust evidence yet suggesting a cessation of IOD variability or a significant change in the IOB mode in the near-term.
Tropical Atlantic Modes
Despite considerable improvements in CMIP5 with respect to CMIP3, most CMIP5 models have difficulties in simulating the mean climate of the tropical Atlantic (Mohino et al., 2019) and are not able to correctly simulate the main aspects of Tropical Atlantic Variability (TAV) and associated impacts. . . Decadal changes in the Atlantic Niño spatial configuration and associated teleconnections might be modulated by the AMV [Atlantic Multi-decadal Variability], but there is limited evidence and therefore low confidence in these results.
Pacific Decadal Variability (PDV)
. . . the extent to which PDV is externally forced or internally generated (Mann et al., 2020) remains an open question, and there is still no robust evidence. Thus, there is low confidence on how the PDV will evolve in the near-term.
Atlantic Multi-decadal Variability
In summary, the confidence in the predictions of AMV and its effects is medium [50%].
Air Pollution (Short-Lived Climate Forcings, SLCF)
Because of their shorter lifetimes, reductions in emissions of SLCF species mainly influence near-term GSAT trends (Chalmers et al., 2012; Shindell et al., 2017; Shindell and Smith, 2019), but on decadal time scales the near-term response to even very large reductions in SLCFs may be difficult to detect in the presence of large internal climate variability.
Volcanoes
By exploring 60 possible volcanic futures under RCP4.5, it has been demonstrated that the inclusion of time-varying volcanic forcing may enhance climate variability on annual-to-decadal time scales (Bethke et al., 2017). Consistent with a tropospheric cooling response, the change in ensemble spread in the volcanic cases is skewed towards lower GSAT relative to the non-volcanic cases (Cross-Chapter Box 4.1, Figure 1). In these simulations with multiple volcanic forcing futures there is: (i) an increase in the frequency of extremely cold individual years; (ii) an increased likelihood of decades with negative GSAT trend (decades with negative GSAT trends become 50% more commonplace); (iii) later anthropogenic signal emergence (the mean time at which the signal of global warming emerges from the noise of natural climate variability is delayed almost everywhere) (high confidence); and (iv) a 10% overall reduction in global land monsoon precipitation and a 20% overall increase in the ensemble spread.
When will we see the benefits of mitigation on the behavior of the climate?
Emergence of mitigation benefits has been studied much less for quantities other than globally and annually averaged CO2 concentration and surface temperature. Boreal-winter temperatures are more challenging for emergence, due to larger variability in boreal winter and adding a decade to the time of emergence, whereas emergence times for boreal-summer averages are similar to the annual temperature averages (Tebaldi and Friedlingstein, 2013). Emergence happens later at the regional scale, with a median time of emergence of 30–45 years after emissions paths separate in RCP2.6 relative to RCP4.5 and RCP8.5; a stricter requirement of 95% confidence level instead of median induces a delay of several decades, bringing time of emergence toward the end of the 21st century at regional scales.
With the exception of global average surface temperatures and September Arctic sea ice area, the IPCC does not expect to be able to detect changes in the 11 other modes of climate and climate variability that it assesses in its WG1 Chapter 4. That includes spatial patterns of warming, precipitation, monsoon, and ENSO — phenomena which are among the most significant for societal impacts.
Further, the IPCC does not expect to detect changes in climate based on changes to air pollution, volcanoes, or climate mitigation policies. Uncertainties are fundamentally irreducible.
Let me make one point very clear — The inability of the climate science community to predict the future does not mean that climate change is not happening, that changes in climate are insignificant, or that humans are not influencing the climate system. The IPCC is very clear that humans are influencing the climate system through greenhouse gas emissions, land use change, particulate air pollution and other factors — And those changes poses risks.
Think of it like this: We can’t predict the state of the economy in 2040, but we know that economic policy is important. Neither you nor I can predict when we might become ill, but I know that health policy is important. Irreducible uncertainty does not mean zero risk.
The human influence on climate is thus not about certainties and crystal balls, but risk management and no regrets.
The steady flow of misinformation about climate science fails to accurately reflect what the IPCC and underlying literature actually says. To the extent that such misinformation influences how decision makers think about the climate system and risk, it undermines the discussion, development, and implementation of robust policies in the face of irreducible uncertainties.
Thanks for reading! Comments, questions, and discussion are invited. Please share this post — in fact the whole series that this post is a part of — with someone who might be interested in (or need to know) what climate science really says. I invite you to subscribe and if you are already a subscriber, please consider upgrading. The work I do here is only possible because of your support.
Jargon warning — In IPCC lingo, the word “baseline” has multiple meanings. One is a period of time against which to evaluate change, as discussed in this post. Another meaning describes scenarios of the future under certain assumptions (e.g., “business as usual” or “current policies”), which I have discussed at length elsewhere.
Wildfire behavior has indeed changed in many places over many decades, and is influenced by many factors, including climate variability and change. The IPCC however does not assess wildfire directly in terms of detection and attribution. Instead, the IPCC focuses on what it calls “fire weather,” defined as hot and dry conditions. The IPCC does not see with high confidence a signal of change in fire weather to date, and does not expect to detect such a signal this century (See Part 3). Wildfire behavior has complex causality, see this excellent discussion by Patrick Brown.
I am always left more knowledgeable and more confused after reading your blog. Is it lazy reporting? How can people be so dishonest? Is the profit model go great that they will waste trillions doing the wrong things? Extremely frustrating.
Dr. Pielke ==> "With the exception of global average surface temperatures and September Arctic sea ice area, the IPCC does not expect to be able to detect changes in the 11 other modes of climate and climate variability that it assesses in its WG1 Chapter 4." "And those changes pose risks."
Certainly, there are climate changes afoot in the future, as there have been in the past. But changes are not necessarily properly or always seen as "risks". Any change can be a risk if one does not anticipate it or adapt to it when it happens. But, "longer growing seasons in the world's breadbaskets" -- an anticipated climatic change over the next 50-100 years -- is not what we would normally call a "risk" but rather an opportunity.
The possibility of a year-around (or even seasonally dependable) northern Arctic shipping route between the Atlantic and the Pacific, between Asia and ports of Europe and the USA, is an anticipated change due to climatic conditions but is not properly seen as a risk but again should be seen as an opportunity.
There are many more examples that could be given, but the Bottom Line is:
CHANGE ≠ RISK