This is Part 2 in the series — Climate Fueled Extreme Weather. You can find Part 1 here, which introduces some concepts and ideas that will be important through the series.
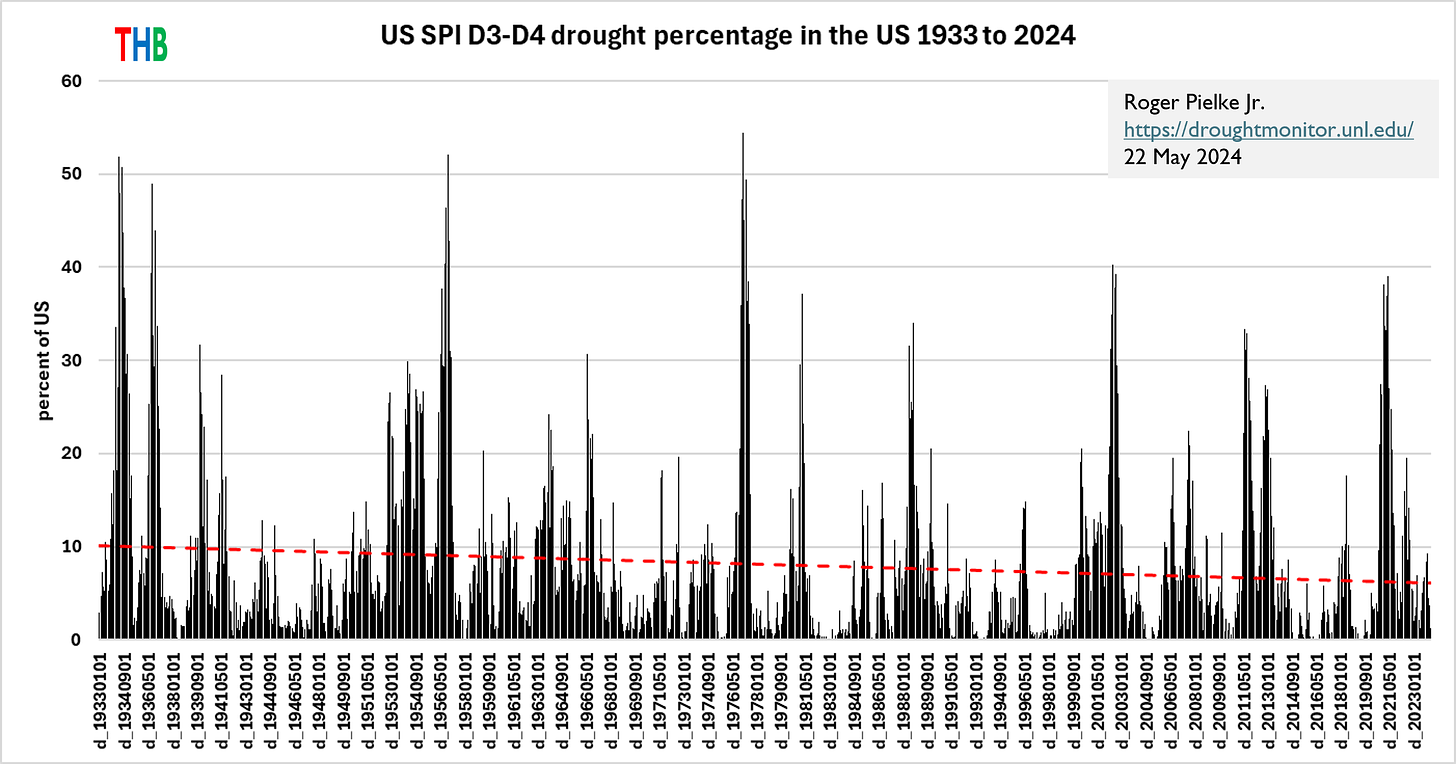
In May, I testified before the Senate Budget Committee and summarized what the Intergovernmental Panel on Climate Change (IPCC) said about trends in drought. My testimony included the figure below showing a decrease in the areal extent of extreme drought conditions in the United States.
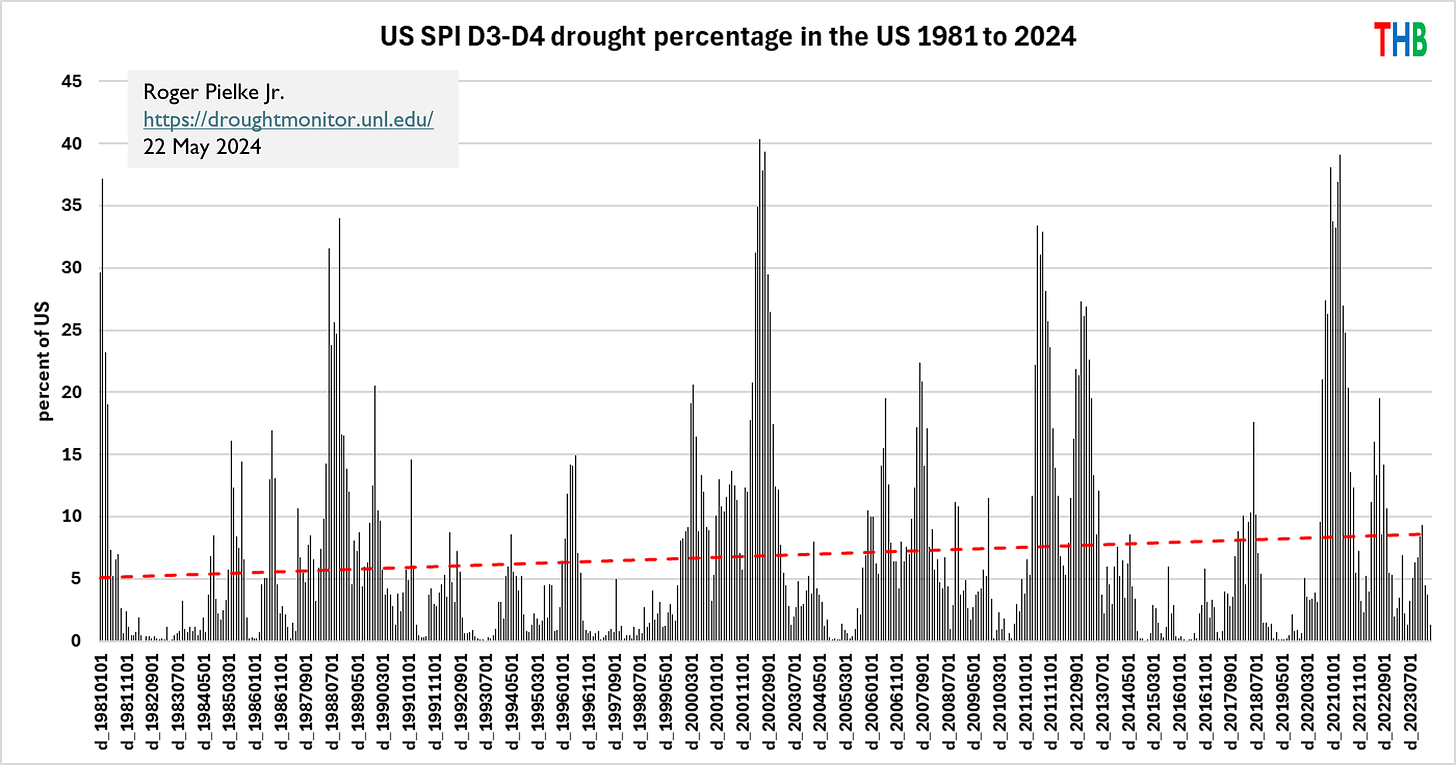
I also included another figure that showed an increase in extreme drought conditions across the United States.
Completing the set, I also included the figure below, showing no trend in U.S. extreme drought conditions.
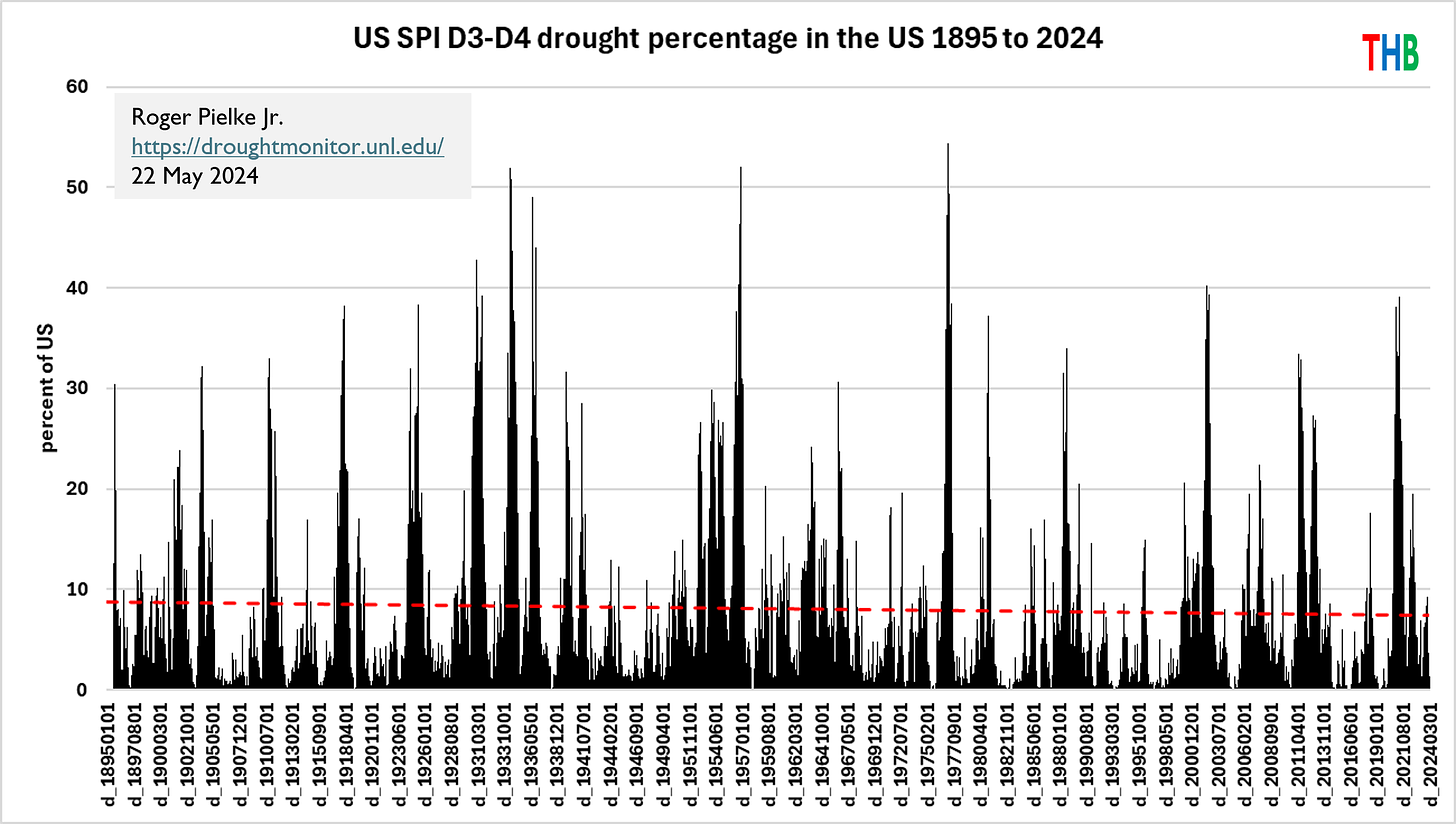
So which is it? Is extreme drought in the U.S. increasing, decreasing, or not changing over climate time scales?
The question has multiple answers, all of which are correct — increasing, decreasing, and not changing. We can arrive at these different trends by selecting different starting dates for our analysis, in this case 1933, 1981, and 1895.
The multiple correct answers coexist because the areal extent of extreme drought in the U.S. varies a great deal from year to year and decade to decade. Some years having no extreme drought and in some years 40% or more of the U.S. experiences extreme drought. Even if the statistics of extreme drought were not changing (i.e., no change in the climatology of extreme drought) we should still expect on climate time scales to observe trends in metrics of extreme drought.
In other words, not all climate trends are climate change trends.
Climate — a statistical description of the climate system — varies on all time scales. The IPCC defines climate variability:
Deviations of climate variables from a given mean state (including the occurrence of extremes, etc.) at all spatial and temporal scales beyond that of individual weather events. Variability may be intrinsic, due to fluctuations of processes internal to the climate system (internal variability), or extrinsic, due to variations in natural or anthropogenic external forcing (forced variability).
For many people, climate variability will be most obvious and familiar in the annual seasonal cycle. The IPCC discusses eight primary modes of variability, including the El Niño Southern Oscillation (ENSO).1
Over longer time periods climate variability creates obstacles to the detection of change in the statistics of extreme weather. The IPCC recognizes the challenge for detection posed by variability in its definition of the detection of change (emphasis added):
An identified change is detected in observations if its likelihood of occurrence by chance due to internal variability alone is determined to be small, for example, <10%.
It is exceedingly common in the media and even in the peer reviewed literature to highlight a trend in a particular climate metric and then conclude that the existence of the trend suffices to conclude that the trend was caused by “climate change.”2 Let’s look at an example.
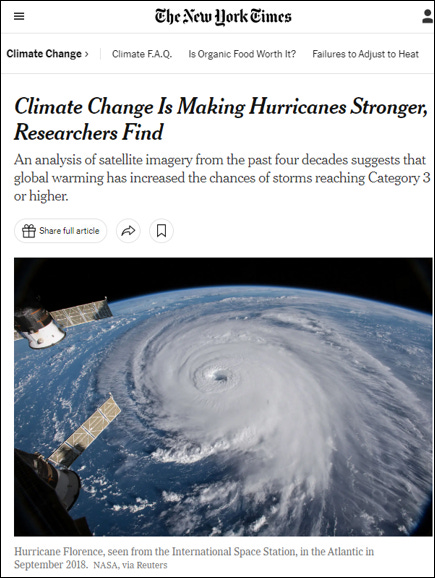
In 2020, the New York Times covered a paper in PNAS by declaring definitively that “climate change is making hurricanes stronger.” Even if we were to correct the headline — “Emissions of Greenhouse Gases are Making Hurricanes Stronger” — that is not what the paper claims nor did it even attempt such an analysis.3
The research paper that the NYT was reporting on acknowledges the importance of various modes of climate variability on tropical cyclones and the authors explain that they have not attempted “formal detection” of changes in tropical cyclone metrics and nor do they make any effort to identify any human influences on tropical cyclones (emphases added):
Ultimately, there are many factors that contribute to the characteristics and observed changes in TC intensity, and this work makes no attempt to formally disentangle all of these factors. In particular, the significant trends identified in this empirical study do not constitute a traditional formal detection, and cannot precisely quantify the contribution from anthropogenic factors.
A formal approach to detecting a change in metrics of tropical cyclones would have to place any observed trends into the context of climate variability and show that such trends are unlikely to result from known modes of variability — as in the drought example above.
The IPCC AR6 is very clear on the detection of trends indicating change in tropical cyclone metrics:
There is low confidence in most reported long-term (multi-decadal to centennial) trends in TC frequency- or intensity-based metrics due to changes in the technology used to collect the best-track data. This should not be interpreted as implying that no physical (real) trends exist, but rather as indicating that either the quality or the temporal length of the data is not adequate to provide robust trend detection statements, particularly in the presence of multi-decadal variability.
What accounts for the enormous gap between what the IPCC concludes and what much of the legacy media says about tropical cyclones, and extreme events more generally?
Among climate activists there has long been a “desire” to connect climate change with extreme events in order to promote climate politics— I get it, extreme events are impactful, tragic, photogenic, and occur every day.
However, reality has so far failed to play along.
As a matter of statistics, extreme events are actually one of the worst places to look for changes in climate. They occur rarely, quality long-term observations are limited, and detection of change with high confidence takes time — recall the two-card stacked deck example from Part 1.
The inability of the IPCC to detect trends indicating change in most types of extreme weather4 — particularly hurricanes and floods — raised frustrations among those who wanted to claim that evidence showed that extreme weather was becoming more extreme. So an alternative approach to connect extreme weather events to climate change was proposed more than a decade ago.
A leading proponent of this then-new approach was Kevin Trenberth, now retired and before that, an intellectual sparring partner of mine5 at the National Center for Atmospheric Research. In 2011, Trenberth proposed that instead of employing the IPCC framework for detection and attribution, we should just assume that all weather events are influenced by humans:
So why does the science community continue to do attribution studies and assume that humans have no influence as a null hypothesis? Given that global warming is ‘unequivocal’, and is ‘very likely’ due to human activities, to quote the 2007 IPCC report, should not the null hypothesis now be reversed? Should not the burden of proof be on showing that there is no human influence?
Trenberth’s proposal to reverse the null hypothesis for associating extreme weather events with climate change has not been adopted by the IPCC or broader scientific community, but it has taken hold across the media and in climate advocacy and politics.6
The last decade has seen the rise of what is called storyline attribution, which now dominates discussion of every extreme weather event.
A storyline provides a putative causal explanation for the incidence of a particular extreme event that just happened and explains why the event was worse than it otherwise would have been, absent the human influence.
For example, from just last week:
Oceans have been warming due to human influences, notably increases in greenhouse gases and a reduction in aerosols;
Warmer oceans are associated with stronger hurricanes;
Hurricane Beryl was an unusually strong hurricane for July;
Therefore, Hurricane Beryl is an example of how climate change results in an increasing number of strong hurricanes.
The recent flood? More moisture available. That drought? Less moisture available. A flood somewhere and a drought somewhere else? Wavy jet stream. Duh. Just connect the dots.
A seemingly plausible-sounding storyline for every event is easy to create. I say seemingly because the storyline approach is free to discount parts of the story that don’t advance the narrative, to change the story event by event, and to ignore events that didn’t happen or did not become extreme. A storyline is a story, not science.
The storyline approach gained so much attention that the 2017 U.S. National Climate Assessment (NCA) was compelled to discuss and legitimize the Orwellian phrase “attribution without detection” — which literally means identifying the cause of a change that has not occurred:
If an attribution statement is made where there is not a detectable change in the phenomenon itself (for example, hurricane frequency or drought frequency) then this statement is an example of attribution without detection. . .
The NCA explained the predictable consequence of identifying the causes of changes that have not occurred:
. . . attribution without detection comes at the risk of increasing the rate of false positives, where one incorrectly concludes that anthropogenic climate change had a certain type of influence on an extreme event when in fact it did not have such an influence.
Trenberth and colleagues explain why under the IPCC framework the attribution of extreme weather events to specific causal factors is so difficult:
[C]hanges in the atmospheric circulation related to climate change are fairly small compared with natural variability, as has been shown especially by several studies at the National Center for Atmospheric Research using 'large ensembles' for 60 years into the future. Although large changes in atmospheric circulation can be readily apparent in a single climate model run, they are not robust and can change considerably in the next run or model. Indeed, what have often been interpreted as differences between models used in IPCC reports may have arisen at least in part from natural variability. Hence, forced circulation changes are not well established, and it is difficult to detect changes in circulation-related extremes in observations because of small signal-to-noise ratios. Thus, the anomalous weather pattern is always the dominant influence for all short-lived events of a week or two, and this is generally true even for years or decades. Accordingly, the conventional approach to extreme event attribution is rather ineffectual in cases that are strongly governed by the changed circulation, with generally an inconclusive outcome. Even when a detectable anthropogenic influence is found in a model, the reliability of that finding cannot carry much weight.
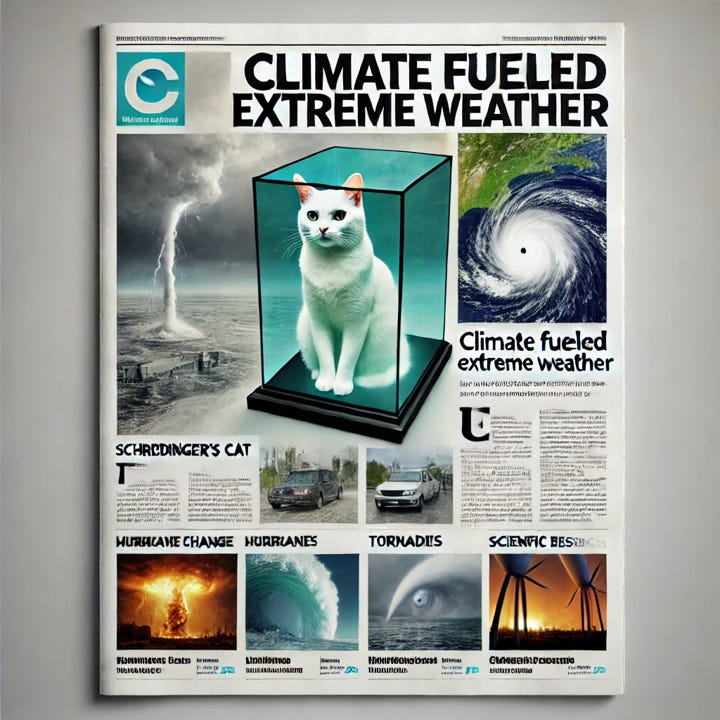
We find ourselves in a situation a bit like Schrödinger's simultaneously alive and dead cat — Looking at popular discourse on climate and the underlying science, we see that “climate change” is claimed to cause many extreme weather events to be more frequent and intense (or pick your favorite metric) even when those changes cannot be detected in observations outside the range of climate variability.
What does evidence show under the IPCC framework for the detection and attribution for possible changes in extreme weather events to date and for the future?
That is where this series goes next.
Thanks for reading! I welcome comments, critique, questions, and alternative points of view. All are welcome here. The THB comment sections have informed discussions and respectful debate among readers with an incredible array of knowledge and experience. Thanks to your support THB is about to hit 25,000 subscribers. THB is my job, which means I work for you. If you value THB, please consider becoming one of my employers by subscribing!
The other seven modes are: the North Atlantic Oscillation and Northern Annular Mode, Southern Annular Mode, Indian Ocean Basin and Dipole Modes, Atlantic Meridional and Zonal Modes, Pacific Decal Variability, Atlantic Multi-decadal Variability, and the Madden-Julian Oscillation. See: IPCC AR6 WG1 Annex IV.
Here I put “climate change” in scare quotes because, as Part 1 explained, climate change is not a cause.
The story of this paper takes some interesting twists and turns.
Not all. Increasing heat waves and extreme precipitation are notable exceptions.
The Climategate emails revealed Trenberth sought successfully to prevent the IPCC from citing a widely-cited paper of ours on hurricanes and climate change.
My view is that Trenberth — a grizzled veteran of the climate wars — with his proposed reversal of the null hypothesis was more concerned with arguing qualitatively that climate change is real against his skeptical opponents, rather than quantifying changes in the climatology of extreme weather events.


Roger, I read your cite #3 from last May.. very interesting. Two questions.. 1) does anyone know who added the incorrect info post peer-review? 2) Did the IPCC ever publish errata?
In other words don’t believe your eyes and ears? Sicily is experiencing a drought. They are blaming it on climate change. Yet they have had droughts before. How do we end this cycle of propaganda and actually let unbiased scientists do their work? In my long life I have experienced many cycles of climate change. I remember hot days in New Jersey before AC where we all slept on the basement floor because that was the coolest place in the house. Consider me a sceptic about climate change and a fan of climate variability.