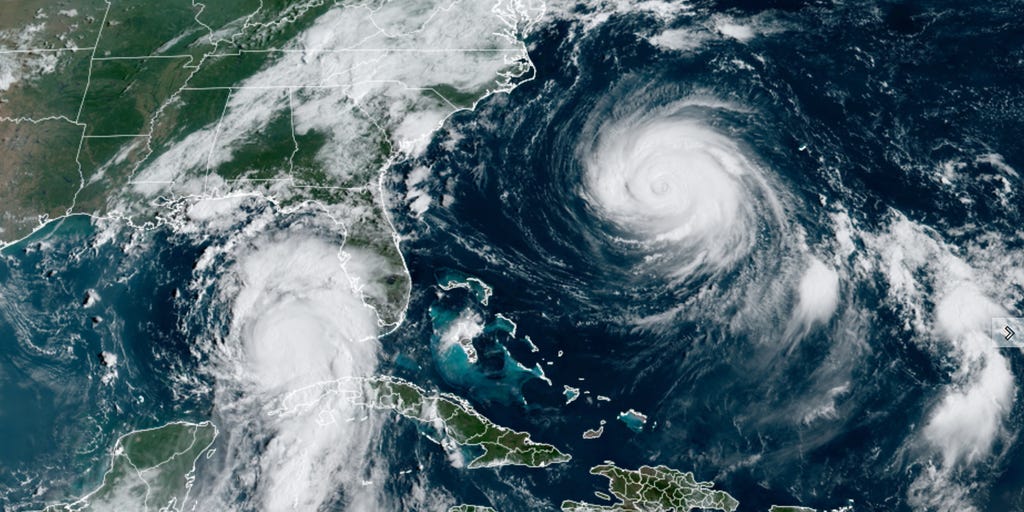
“At present, there is little scientific consensus about trends in global or regional [tropical cyclone] activity, either in the past, as detected in observations or in climate model simulations, or in the future as our climate continues to change"
As November comes to an end, the 2023 North Atlantic hurricane season is in the books. Today I share updated figures and analyses from our peer-reviewed work on hurricanes1 that summarize the season and place it into longer term historical context.
Mainland U.S. Hurricane and Major Hurricane Landfalls, 1900 to 2023
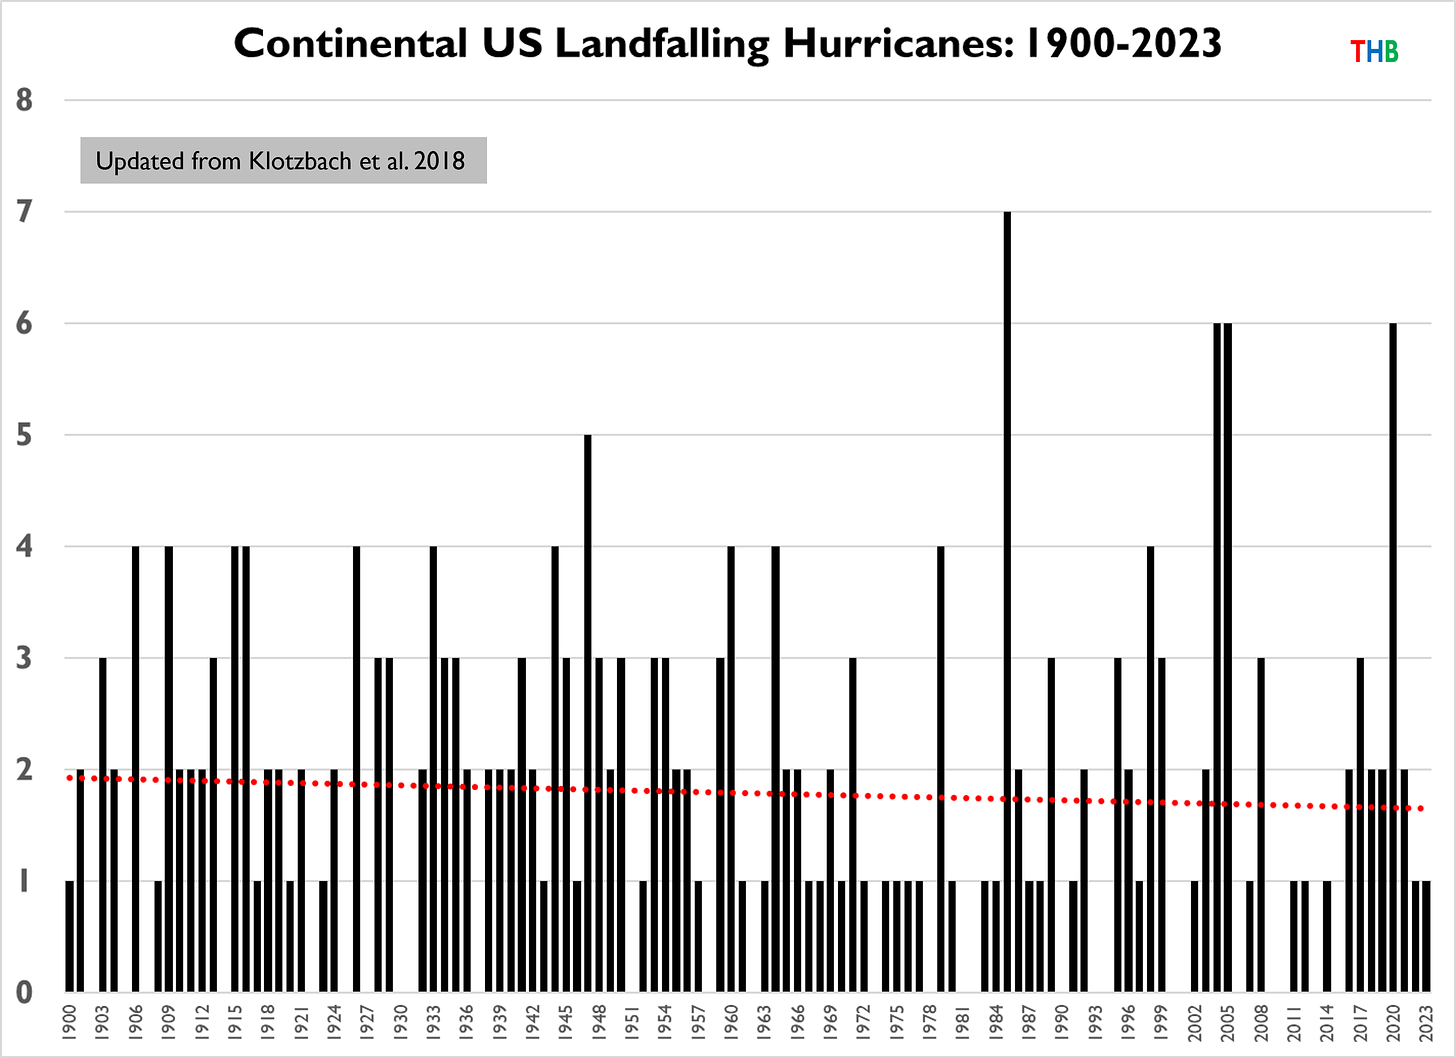
The figure above shows tropical cyclones of hurricane strength (i.e., Category 1+) that made landfall along the continental United States (CONUS) from 1900 to 2023. There was one landfall in 2023, Hurricane Idalia in Florida.

The figure above shows tropical cyclones of major hurricane strength (i.e., Category 3+) that made landfall along the continental United States, with Hurricane Idalia in 2023 making landfall as a Category 3 storm.
There are no trends in either landfalling CONUS hurricanes or major hurricanes from 1900 to 2023.
Normalized CONUS Hurricane Damage 1900 to 2023
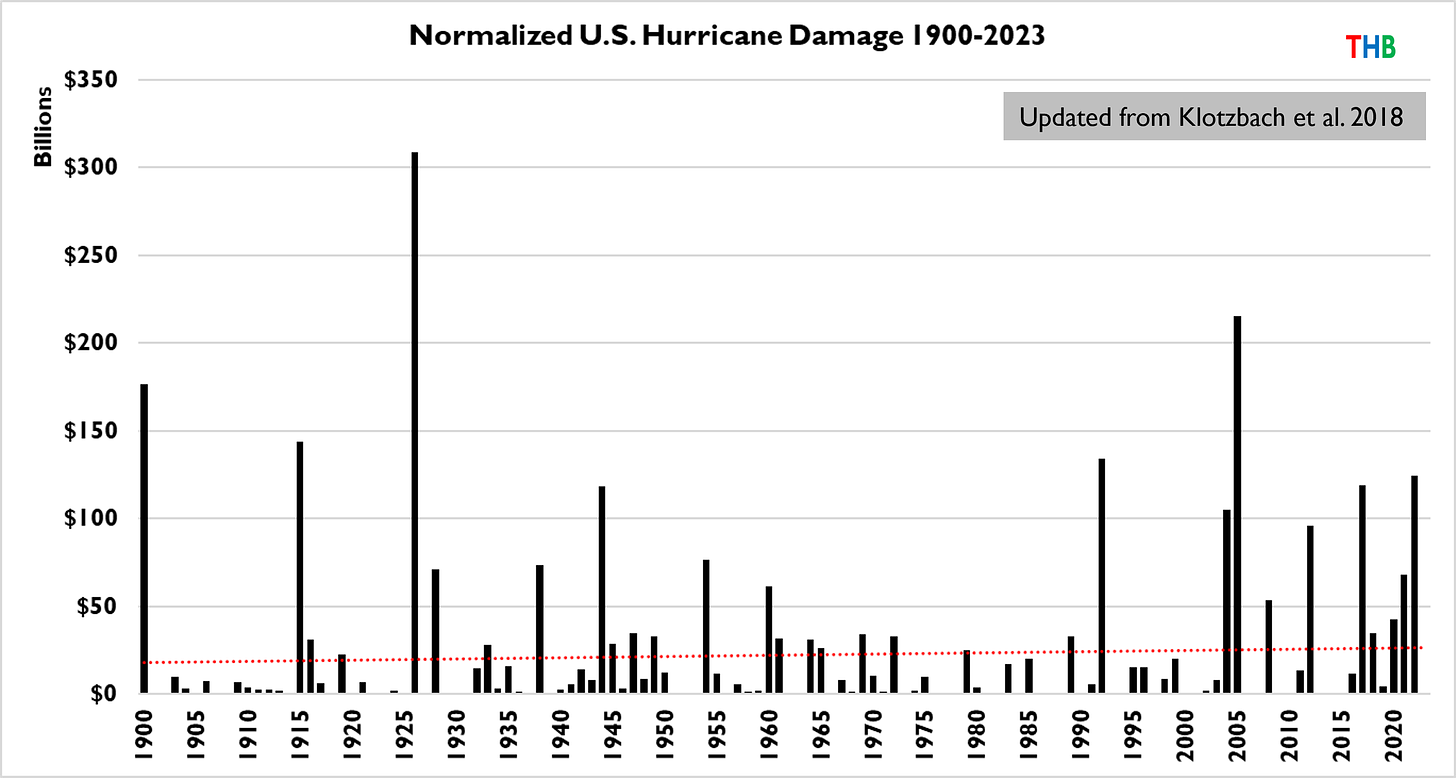
Hurricane Idalia has to date resulted in about $310 million in insured loss claims in Florida, which represents a much lower figure than was originally estimated by catastrophe modelers. This equates to a total loss of less than $1 billion.2
The figure above provides an update of our normalized CONUS loss time series to 2023 values — showing an estimate of the damage in each year if hurricanes of the past made landfall with today’s level of population and development.
There is no trend in normalized losses from 1900, however, there is an upwards trend from the 1970s. Given that there has been no increase in landfalling hurricanes or major hurricanes, we would not expect to see any increase in normalized losses.3
The 1926 season has pushed over $300 billion and 2005 over $200 billion. In coming months I will update the global catastrophe loss time series, once 2023 comes to a close, but I can tell you now that weather-related insured and total economic losses of 2023 will come in lower than in recent years due to 2023’s lack of significant hurricane impacts.4
What Role did ENSO Play in the Low Losses of 2023?
One of the strongest statistical relationships observed in Atlantic hurricane behavior involves the El Niño-Southern Oscillation (ENSO). This year saw a transition to El Niño conditions in the equatorial Pacific, which historically has been associated with depressed hurricane activity, landfalls and damage.
This year saw slightly above average overall activity, just about average numbers of major hurricanes and losses far less than average or median. The figure below puts 2023 into historical context according to the state of ENSO (with 2023 indicated by the red triangle). The top panel zooms in to El Niño years (ONI >= 0.5) and the bottom panel shows all years, 1950 to 2023.
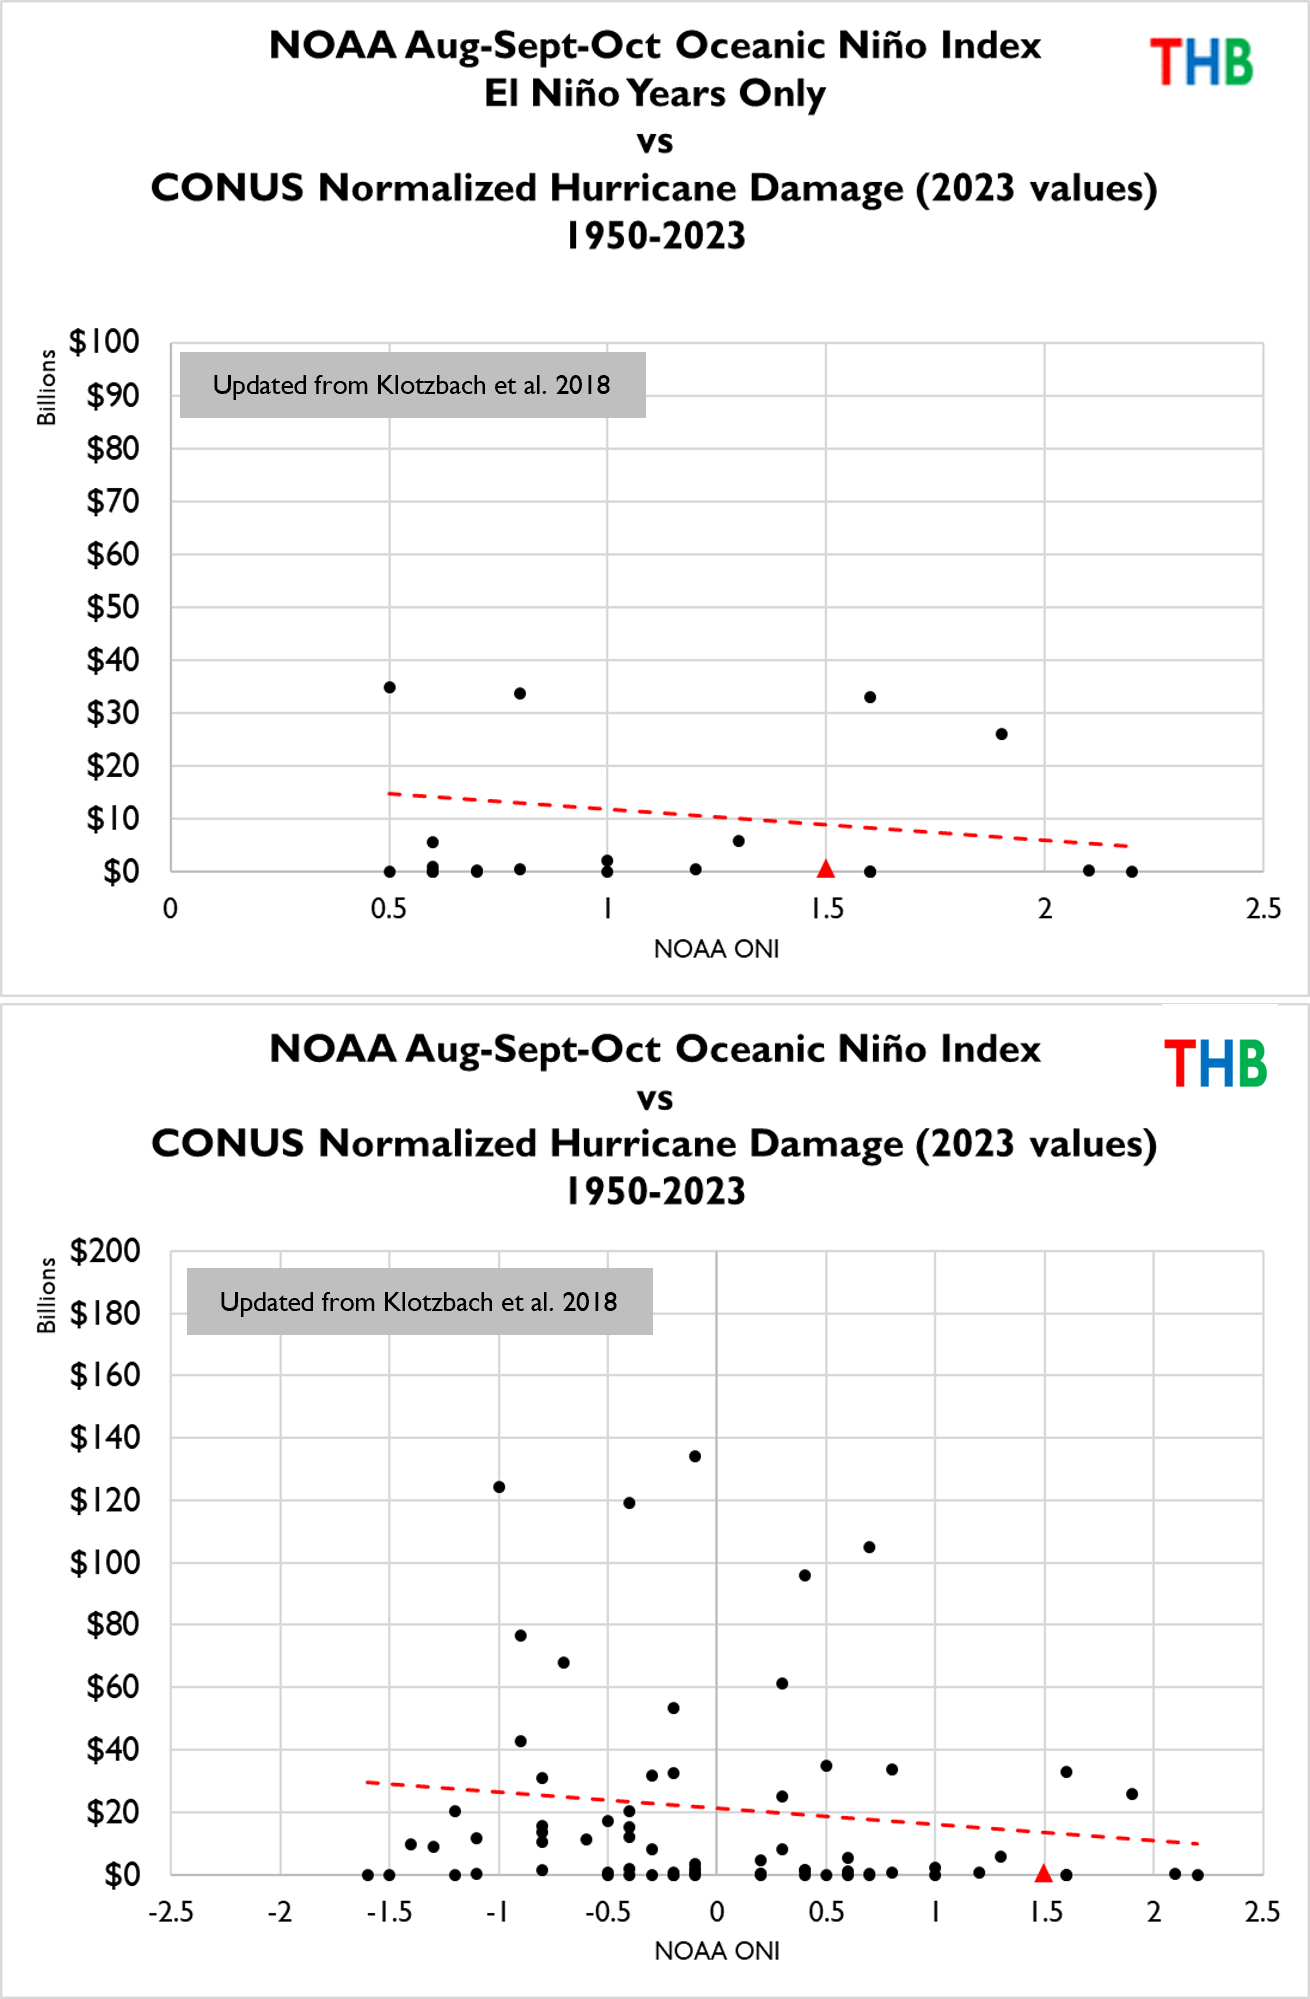
The low economic losses of 2023 certainly fit the historical pattern associated with ENSO and the new data point in the time series will reinforce that relationship. But were the low 2023 losses a result of ENSO or just good fortune?
I suspect a bit of each, with the precise amounts impossible to tease out. I note that in the 9 hurricane seasons with Aug-Sept-Oct ENSO ONI values of 1.0 or greater, total normalized losses have never exceeded $35 billion.5 Of course, had Hurricane Idalia taken a slightly different track, we would have the first such storm.
The data is informative and suggestive, but irreducible uncertainties and plain old ignorance are ever-present as well. My guess is that the relationship that we first discovered in 1999 between ENSO and hurricane damage is not quite as strong as the statistics indicate, but that is just a hunch.
Can Seasonal Hurricane Activity be Forecast Accurately?
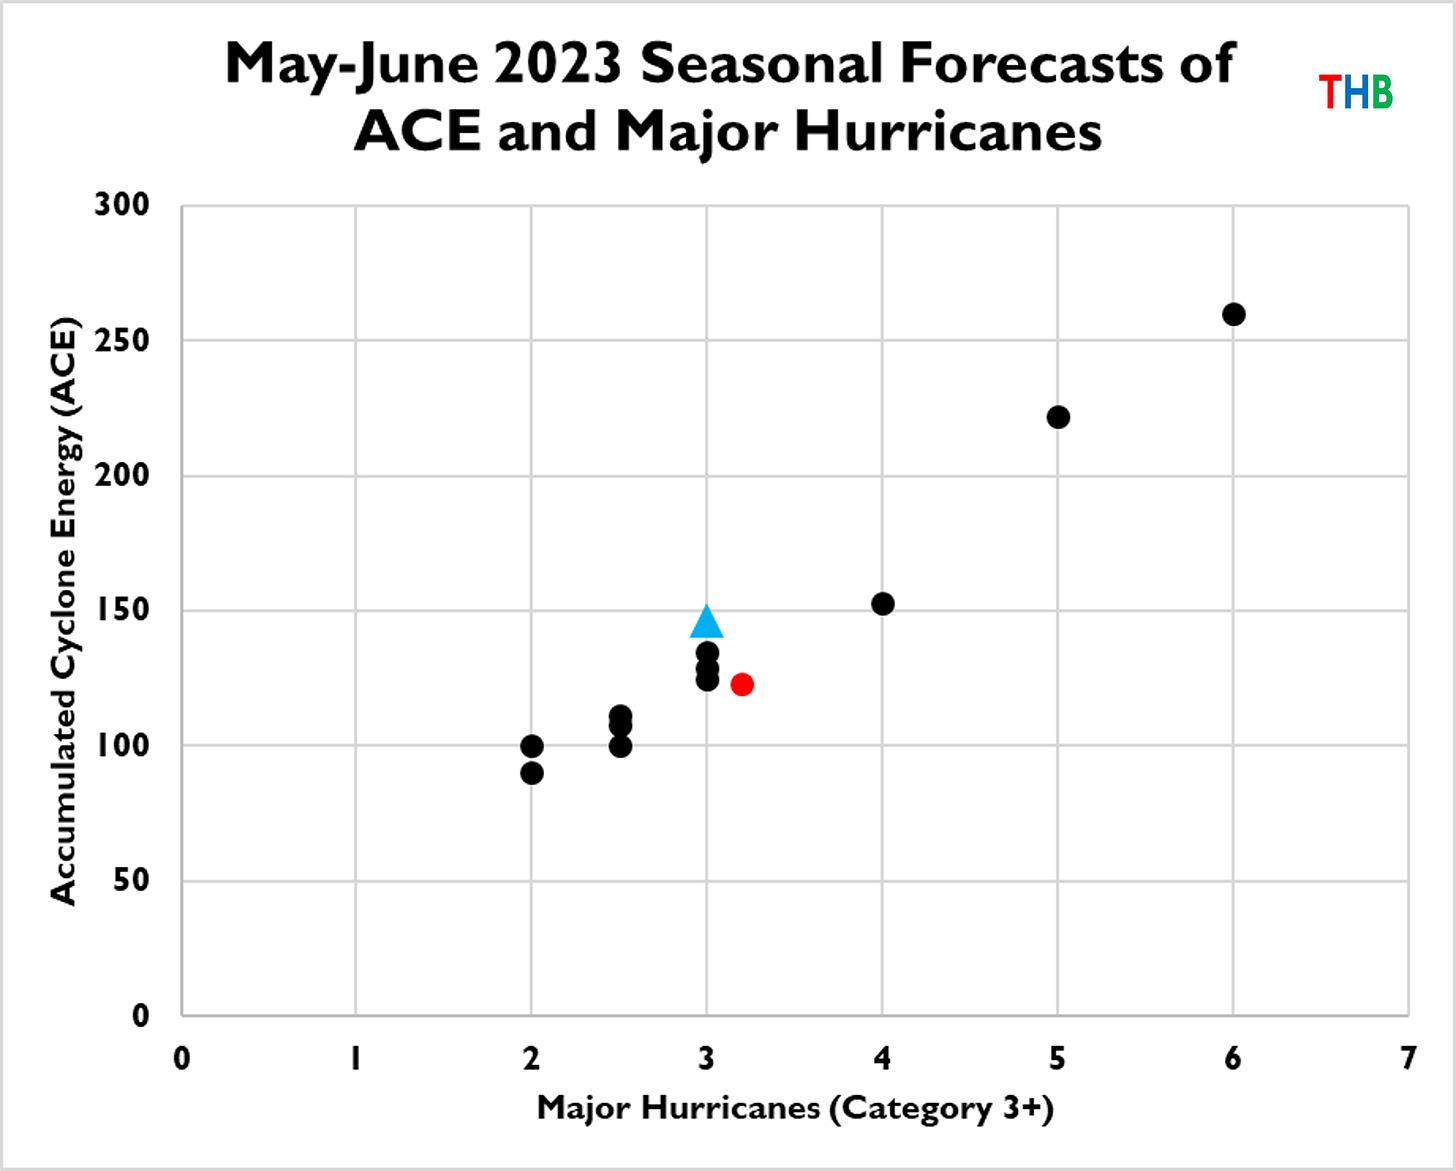
The figure below shows eleven different 2023 season hurricane forecasts complied by the Barcelona Supercomputing Center, issued in May-June of this year for seasonal activity. I have displayed all 11 forecasts that included a forecast of both major hurricanes and ACE (accumulated cyclone energy, a metric of overall activity).6
The red marker shows the 1991 to 2020 averages for both variables and the blue triangle shows 2023 values. You can see that 8 of the 11 forecasts were outperformed by the historical average, indicating that as an ensemble, these 11 forecasts were not skillful.
Overall, seasonal hurricane forecasting is a crapshoot, however the head of the class is Phil Klotzbach and his team at Colorado State University. They rigorously evaluate their forecasts, with their 2023 verification just published today, here in PDF. My evaluation of 2022 seasonal forecasts can be found here.
Thanks for reading! I welcome your comments, questions and suggestions. Please share this post with anyone who might be interested. If you are not yet a subscriber, what are you waiting for?
Note that our peer-reviewed work on U.. hurricanes, which has been cited 1,000s of times in the scientific literature, is not referenced in the just-released U.S. National Climate Assessment. In fact, the NCA stated in its review process that they were unaware that our research even existed. Welcome to the bizzaro world of climate science!
NOAA’s “billion dollar” loss time series lists Idalia incorrectly as a $2.5 billion event, which is clearly taken from the initial catastrophe model estimates that have proved to be in error. NOAA’s loss estimate was published just days after Idalia made landfall and has not been updated since. NOAA further provides no sourcing nor no accounting for its methodology. Once again, the “billion dollar” disaster time series shows itself to be an exercise in PR, not science.
Major hurricanes are responsible for >85% of normalized losses.
U.S. hurricane losses have historically made up a majority of annual global catastrophe losses, making the notion of “global” a bit of an misnomer.
Of course, the same can be said for the 8 strongest La Niña years as well (ONI <= 1.0)!
Interestingly, the relationship of MH and ACE is pretty much linear, as MH generate the most ACE.


Thank you for this information which I find extremely interesting. I make sure I pass it along to friends and family so they are aware.
Headlines in the media tend to exaggerate climate impacts. I suppose if it bleeds it leads, even if incorrect, still applies.
"...The 1926 season has pushed over $300 billion and 2005 over $200 billion. In coming months I will update the global catastrophe loss time series, once 2023 comes to a close, ..."
This makes no tense! (pun intended). What was it that was 'pushed over $300 billion', and how can a season almost a century ago 'has pushed' whatever it was that was pushed?
Maybe "...The 1926 season has pushed [damage normalized to 2023$] over $300 billion and 2005 over $200 billion. In coming months I will update the global catastrophe loss time series, once 2023 comes to a close, ..."
Speculating, are you trying to say that 'the 1926 season, when (re)normalized to 2023 dollars, will slightly exceed $300b?"
If so, shouldn't the y-axis on your 'Conus Normalized Hurricane Damage (2023 values)' be labelled 'Billions (2023$)? Its clear that you have redone the graph, so adding the '(2023$)' should have been trivial to do.
Yeah, I know, these are just nits, but hey, what's a nit-picker going to do?
Frank