El Niño and U.S. Hurricane Damage
What to expect as we move into the active part of the Atlantic hurricane season

I remember it like it was yesterday. Almost exactly 25 years ago I was sitting exactly where I am as I write this, working on an analysis using our then-newly developed normalized hurricane damage data. At the time, it was well understood that the El Niño-Southern Oscillation (ENSO) had direct effects on Atlantic hurricane activity, thanks to the pioneering work of William Gray (RIP).
Along with one of Dr. Gray’s students, Chris Landsea, I wondered if those effects could be seen in our record of normalized continental U.S. hurricane damage. They sure could — we found a very strong relationship and more recently updated that original analysis. Today I provide a further update, using data through 2022.
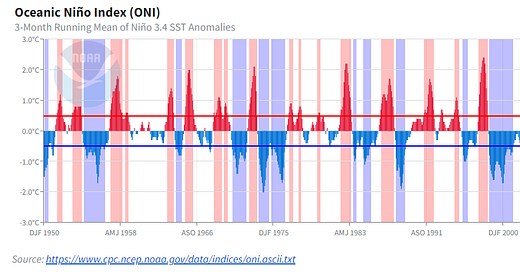
The figure at the top of this post shows the NOAA Oceanic Niño Index (ONI), which is technically defined as the 3 month running mean of ERSST.v5 SST anomalies in the Niño 3.4 region, based on centered 30-year base periods updated every 5 years. Less technically, the ONI is a measure of sea surface temperatures in the box shown in the figure below and is a key metric for defining El Niño and La Niña events. ENSO matters because it has consequences across the world.

In the Niño 3.4 region, according to NOAA an El Niño occurs when SST anomalies (that is, the difference from baseline) are greater than 0.5 Celsius, and when the anomalies are less than -0.5 Celsius. that is called a La Niña. You can see the ups and downs of the oscillation in the figure at the top of this post, which also shows NOAA’s thresholds for El Niño/La Niña conditions and various periods when the thresholds were exceeded. Conditions that are neither El Niño or La Niña are called neutral. Right now the world appears to be entering the El Niño phase of ENSO.
For Atlantic hurricane activity what matters is the ENSO state during the peak of hurricane season — August-September-October — indicated as ASO along the X-axis of the figure at the top of this post. You can have a look at the NOAA ONI Niño 3.4 data here. The ASO column is what I use in the analysis below, for the period 1950 to 2022.
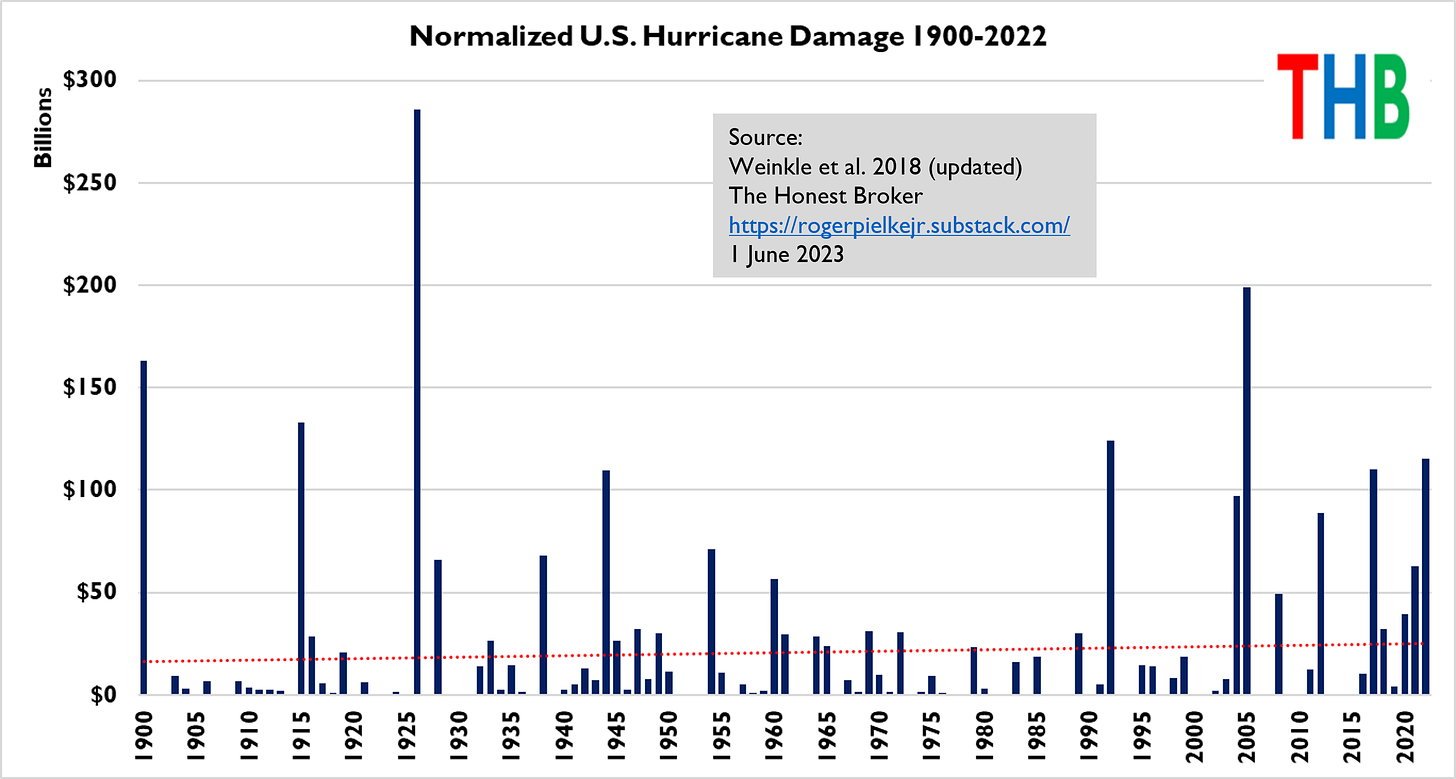
The other data I use are the updated (to 2023) values of our normalized continental U.S. hurricane damage. You can see that time series below.

The figure below shows that more than 95% of normalized hurricane damage occurs in the months of August-September-October. U.S. hurricane damage is globally significant as it generally represents a majority of global catastrophe losses.

The figure below shows a scatterplot of the ONI vs. annual U.S. normalized hurricane losses for the period 1950 to 2022. Median damage is significantly different across the ENSO phases.
While there is a lot of scatter, there are also some strong signals. For instance, of the 21 El Niño years, 6 (~29%) saw no damage and 13 (~62%) saw < $1 billion. In contrast, the 21 La Niña years saw 3 with no damage (~14%) and only 6 (~29%) with <$1 billion.
Years with >$10 billion is damage show similar differences, with 5 (~24%) in El Niño years and 11 (~52%) in La Niña years. There has been only one El Niño year with >$35 billion and 4 La Niña years.
Of course, a big loss year can happen at any time — 2004 was an El Niño year and saw almost $100 billion in damage due to a flurry of storms striking Florida.
Here are my takeaways:
The risks of large losses during an El Niño year are roughly half (or less) that in La Niña years.
Large losses can happen in any year.
Sophisticated decision makers with deep pockets can take advantage of this information.
For coastal residents and public officials this may be interesting but doesn’t change the importance of being ready every year.
Importantly, the difference in damage between El Niño and La Niña years is an order of magnitude greater than even the most aggressive projections of the effects of future climate change on hurricane damage at the end of the century. The observed variability in hurricane activity and corresponding damage is much larger than the expected signal of climate change. We explored this question quantitatively and found, much to our surprise, assuming the accuracy of modeled projections of future changes to hurricanes, detecting a signal of climate change in hurricane damage takes “between 120 and 550 years, reflecting a large uncertainty. It takes 260 years for an 18-model ensemble-based signal to emerge.” You can read more on the surprising math of climate signal emergence here.
ENSO is among the most important climate dynamics on the planet — not just because of its impacts across the world, but because it allows us some degree of anticipation based on experience to prepare for those impacts before they occur.
Further work on this topic might look at different ENSO indicators, regionality of losses and possible relationships with other modes of climate variability. Several decades ago a lot of effort was spent on understanding the societal impacts of climate oscillations and variability. Since then long-term climate projections seem to have pushed that work aside. Research on climate variability continues to offer excellent opportunities to better understand climate and its societal impacts.
Thanks for reading! I welcome comments, questions and data analysis requests. You can help THB by clicking on the little heart at the top of this post, sharing it with friends, colleagues and on your favorite social media platform.


Roger, you are one of my very favorite energy scholars and historians.
Shucks I was hoping I did not have to put my shutters up. The damage to our area in 04 was very bad, two storms in one year. Lots of trees lost and roofs as well. I can attest that you should not rest on your laurels because it’s an El Niño year. Good luck to everyone this season.