Do El Niño Years Have More Disasters?
A new analysis of disaster deaths and losses by ENSO phase

An El Niño is coming! An El Niño is coming! Well, a 62% chance according to the most recent forecast of the U.S. National Oceanic and Atmospheric Administration (NOAA).
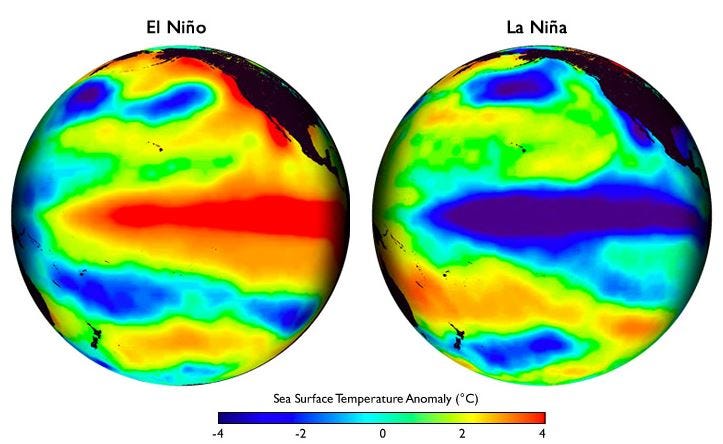
What is an El Niño event anyway? NOAA explains:
El Niño and La Niña are opposite phases of a natural climate pattern across the tropical Pacific Ocean that swings back and forth every 3-7 years on average. Together, they are called ENSO (pronounced “en-so”), which is short for El Niño-Southern Oscillation. The ENSO pattern in the tropical Pacific can be in one of three states: El Niño, Neutral, or La Niña.
The ENSO pattern is important because it affects weather and climate all around the world through what are called teleconnections. Back in the 1990s I spent a lot of time researching ENSO and its societal impacts under the tutelage of the world’s expert on the topic, Mickey Glantz. Among the research I did was to discover, along with Chris Landsea, that U.S. hurricane damage has a strong relationship to ENSO, with damage suppressed during El Niño and much higher in La Niña (here is an update). That was a finding that you can literally take to the bank.
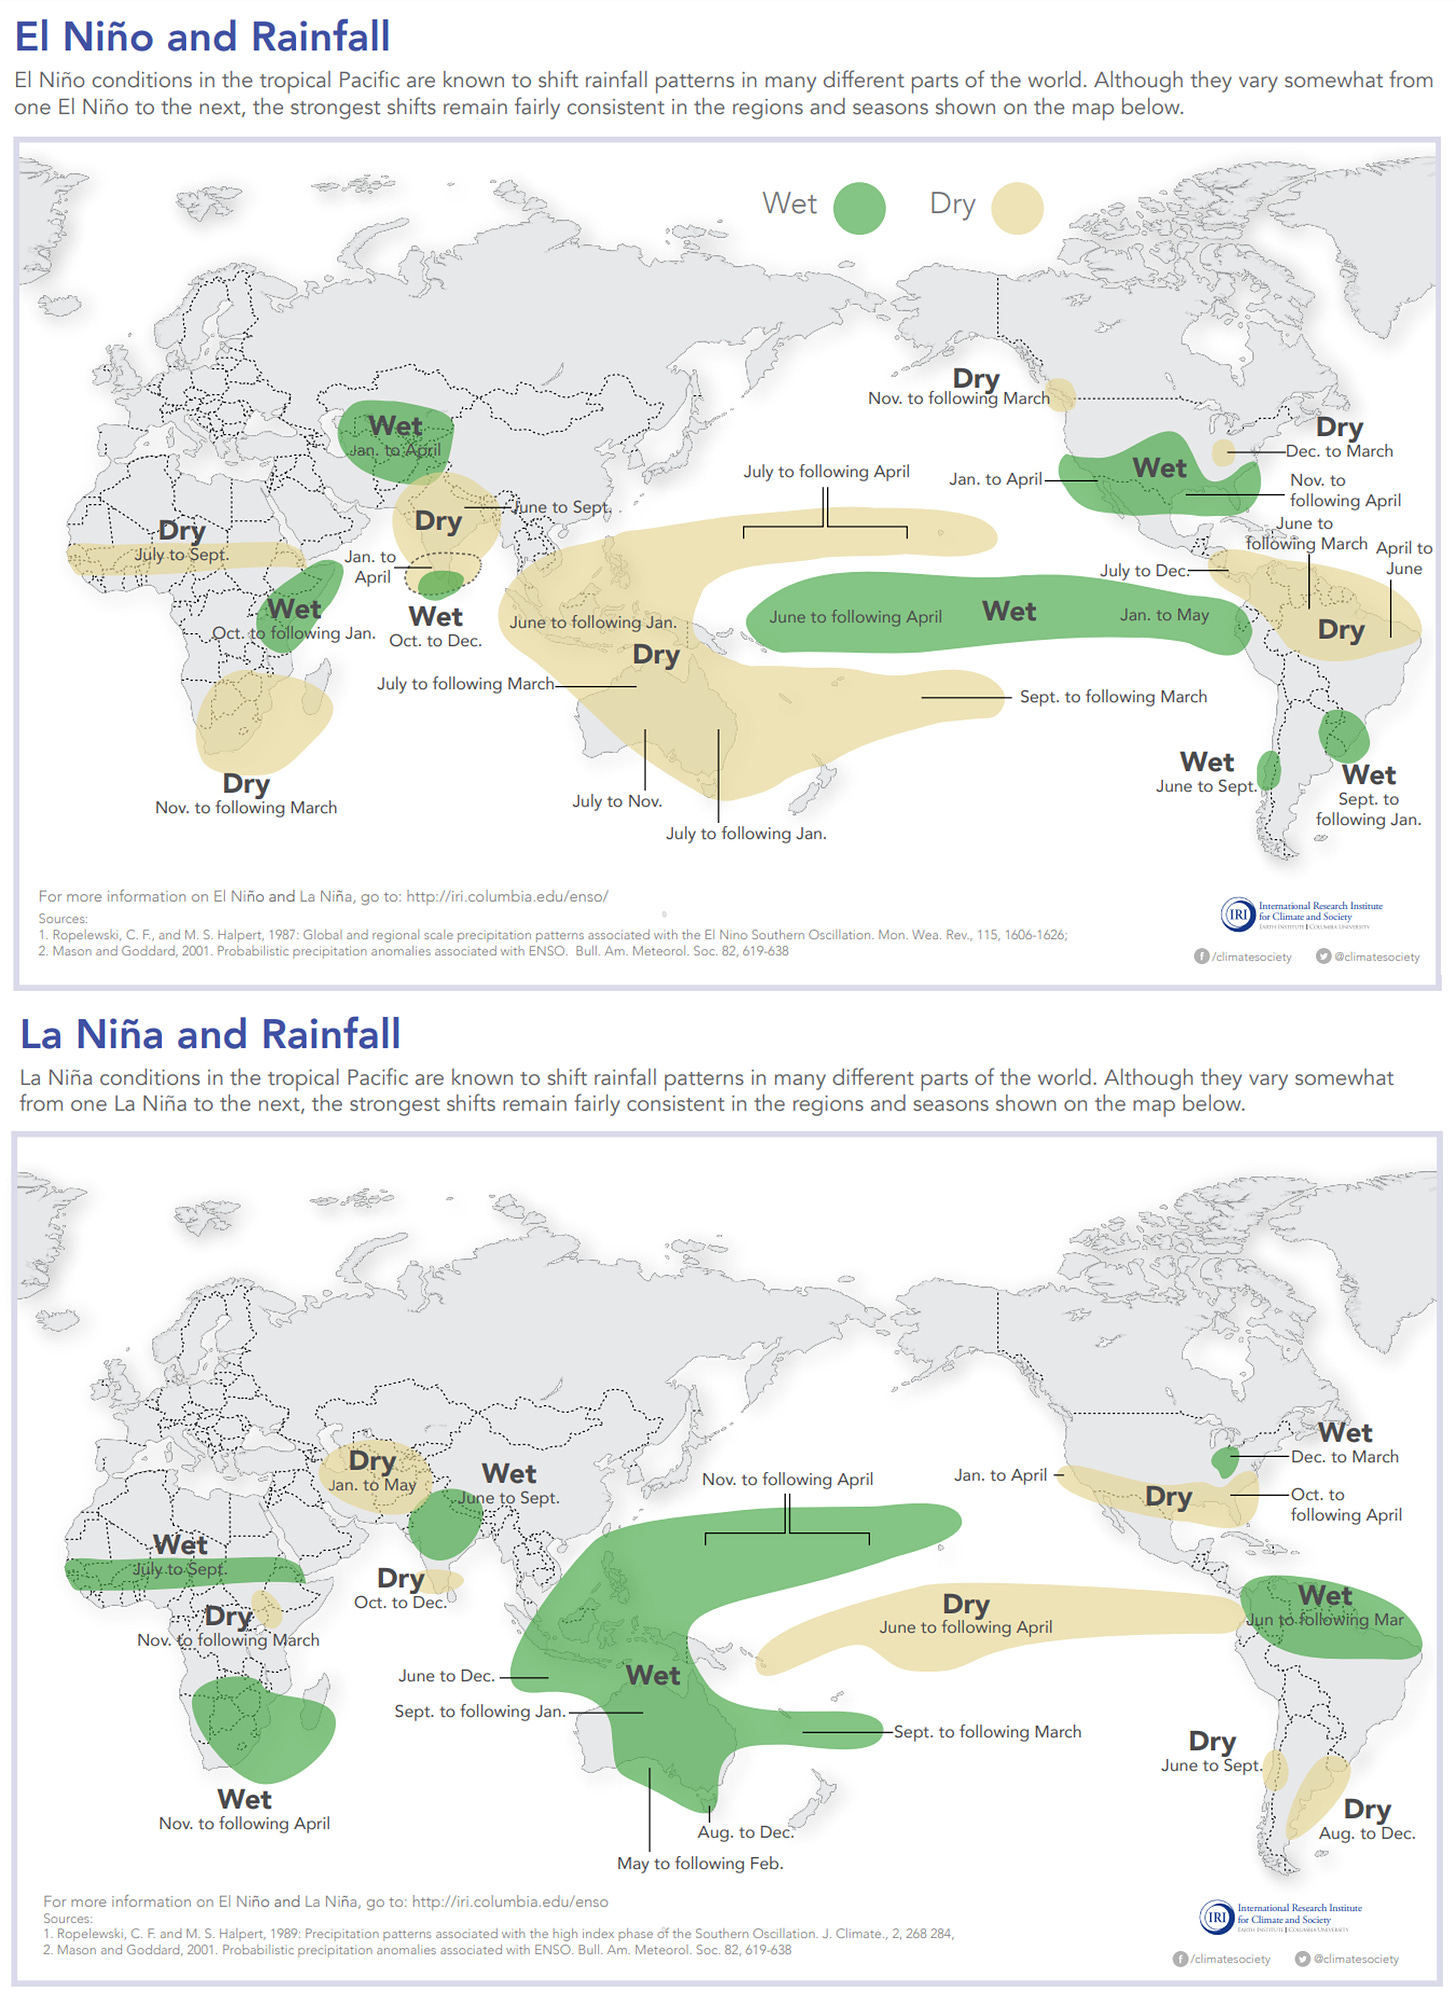
The world is currently in an ENSO neutral state, having just been through a rare “triple dip” three-year La Niña, and appears to be heading towards an El Niño. It is well understood that the ENSO state results in different types of climate patterns around the world, and thus different risks of extreme events. The figure below illustrates how rainfall patterns differ around the world between El Niño and La Niña.

I thought it would be useful to look at data by ENSO phase at the global level on disaster losses — both dollars and deaths.
To perform such an analysis requires categorizing each year according to its ENSO state: El Niño, La Niña and Neutral. Here, I rely on a classification developed by NOAA (officially MEI/MEIV2), but there are other ENSO indices that might be used at the annual and seasonal time scales.
Since, 1990, NOAA’s classification that I use here has 6 La Niña, 7 El Niño and 20 Neutral years, even thought other years may have had partial ENSO conditions in various states. That is obviously not a lot of data, and results should be interpreted accordingly — with caution. Disaster deaths can be found in the EM-DAT database and Munich Re tabulates economic losses from weather and climate.
With data in hand, let’s go straight to the results.
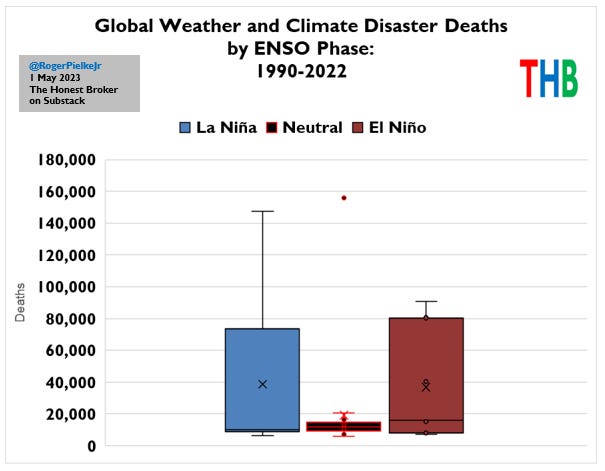
The figure below shows a box-and-whisker plot for disasters deaths by ENSO phase from 1990 to 2022.
Large disasters can happen in any year. In 2008, Typhoon Nargis in Myanmar killed more than 140,000 people, contribution the majority of deaths in the most deadly La Niña year since 1990. in 2010, more than 50,000 people died in extreme heat in Russia, contributing the most deaths to the deadliest El Niño year. A Bangladesh cyclone in 1991 dominated the most deadly Neutral year.
The medians are quite similar: ~10,000 (La Niña), 16,000 (El Niño) and 12,000 (Neutral). These data give little reason to think that any ENSO phase carries more risk of global deaths than another, even as ENSO has differential effects in locations around the world — at least based on the NOAA classification of annual ENSO states.
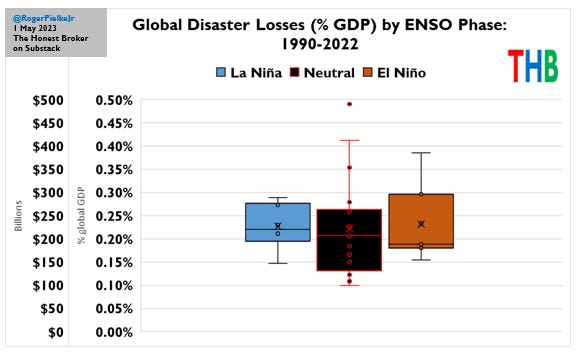
Let’s next look at economic losses 1990 to 2022 by ENSO phase, shown in the figure below.

As with deaths, the figure shows that there is not a lot to differentiate the different phases of ENSO in terms of overall global disaster losses. Median losses, as a percentage of global GDP are: ~0.22% (La Niña), ~0.19% (El Niño) and ~0.21% (Neutral).
My former colleague and mentor, the late Stan Changnon (a climatologist for the ages), always told me in the 1990s that that he believed based on his knowledge and experience that La Niña posed more risk for disasters than did El Niño. These data would seem to bear that out, with median damage (in 2022 dollars) of ~$215 billion/year during the former and ~$183 billion/year during the latter. However, the averages are almost exactly the same ($221B vs $225B). With the effects of ENSO on U.S. hurricanes it is likely that U.S. losses are generally lower in El Niño years, where Changnon’s hypothesis holds up very well.
These data tell us that the ENSO phenomenon is important for our understandings of disasters not because of its effects on global aggregate disasters, but rather, because ENSO changes the risks of extremes in different places.
Understanding the ENSO phenomena thus offers an important body of information with which to better anticipate and prepare for disasters, based on what we know about how risks can change from year to year.
Comments welcomed!


Agree this is an excellent post, and informative. Question: Because there have been essentially an equal number of El Ninos and La Ninas, would it be correct to infer that these patterns cannot be attributed to global warming or emissions growth?
What i notice from coverage is that even though "the world is careening to unlivable conditions" when there has been no temperature increases for years, with a likely El Nino coming there seems to be glee that finally, FINALLY, we'll get some catastrophic warming and therefor death which will then show us deniers how wrong we have all been.
Just my take on it.