Normalized Disaster Losses in Australia
The Insurance Council of Australia shows us how it's done

While I’ve been in Australia this week I have had a chance to catch up with colleagues at Risk Frontiers (where I’ve been an associate for many years) — a risk modeling firm focused on the Asia-Pacific region. Risk Frontiers has recently completed a comprehensive update of normalized Australian disaster losses for the Insurance Council of Australia (ICA) that was released just last week.
A disaster normalization seeks to answer the question: How much loss would extreme events of the past cause under today’s societal conditions?
You can read more about normalization at this series of posts:
Part 1: What is a "normalization"?
Part 2: Normalized disaster losses in Europe 1995 to 2019
Part 3: Normalized Hurricane Losses in the United States, 1900 to 2021
Part 4: How would we know if disasters are becoming more costly due to climate change?
Part 5: Climate change and disaster losses
The 2023 ICA/Risk Frontiers update to normalized Australian disaster losses is based on a 2008 paper by Ryan Crompton and John McAneney. The ICA is demonstrating real scientific leadership here by supporting an analysis that places historical losses into context, even though the results of that analysis may not fully align with popular political and media narratives. Bravo to the ICA.
With that, let’s get to the numbers published on the ICA website.
The figure below shows the unadjusted losses numbers for disasters 1967 to 2022, Note that it is common in the Southern Hemisphere to display losses from 1 July to 30 June, but the figures below are calendar year. Losses thus far in 2023 have been minimal, but are not shown here, as the year is incomplete.

You can see in the figure above the rapid escalation of disaster losses over the past 50+ years. If this were the “billion dollar losses” U.S. National Oceanic and Atmospheric Administration, the analysis would stop here and a press release would be issued focused on the dramatic increase and climate change, feeding a media frenzy.
Fortunately Down Under, the analysis does not stop there.
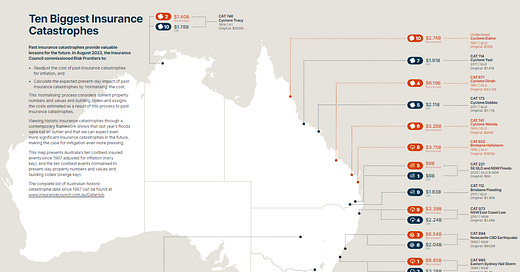
The figure below shows the results of the normalization (to 2022/23 AUS$), for all hazards — Australia does have earthquake losses, 16 events out of more than 700 in the ICA database.

You can see in the above figure that the sharp upwards trend has disappeared completely and there were several calendar years with significantly larger losses than those of 2022. Placing disaster history into proper perspective is crucially important for understanding true risks and the complex relationship of weather and society over long periods of time.
The ICA’s CEO Andrew Hall gets the last word today:
This new data shows that when – not if – extreme weather events strike large population centres in the future we can expect them to have a greater impact and be more costly, making the case for risk mitigation even more pressing.
We can’t wait until disaster strikes, we need to act now by investing more to make communities more resilient, reform land-use planning and building codes and, in some cases, move people and homes out of danger altogether.
Correction: The post originally said that the normalization was in AUS$2017. I have been informed that they are actually AUS2022/23 and there is a typo on the ICA data page. Corrected.
Thanks for reading! Please share this post with your favorite Aussie or, really, with all your friends, family and favorite journalist on the climate beat. This is a reader-supported publication, so your support, at any level, is very much appreciated. Honest brokering is a group effort, and I not only welcome but depend on your engagement, suggestions, critique and discussion. The material above has been just included in my slide deck for my lecture later this week, and I’ll have more to say about my talk before the week is over.


I did not go to the links but did not see mention in your article of the increase in buildings and infrastructure that has occured since 1967. It there are twice as many buildings in a a loss area then that should translate into twice as many claims hence twice the value before adjusting for inflation.
The increase in valuations from 1967 and 1974 are enormous. Not surprising, average house prices seem a huge component.
https://datamentary.net/australian-house-prices-over-the-last-50-years-a-retrospective/