I’ve been thinking a lot about one of the comments I received from a listener to the recent podcast I did with Michael Liebreich. Following up our discussion about disasters and climate change the listener observed: “I find it interesting (never thought of that) that part of the economic impact is because we build more and in in appropriate ways.” He is right. This post is the first in a series that will describe research I have been involved in for 25 years focused on trying to make sense of trends in disasters in the context of both societal and climate changes.
Studying the relationship between climate change and disasters is challenging because there are many moving parts that contribute to the outcomes that we care about, like property damage or casualties. For instance, the frequency and intensity of extreme events can change and vary over time, but so too does the exposure and vulnerability of human settlements which are subject to experiencing disasters. Much of the work that I have been involved in seeks to separate out and quantify the role of physical factors (the “natural” in “natural disasters”) from societal factors in long-term trends in disaster losses.
One way that researchers make this separation is by adjusting historical loss data to account for relevant societal changes. We seek to standardize losses to a common base year — a process which we have called “normalization.” If this procedure is done properly, then trends in the resulting normalized time series should match up well with climatological trends in the relevant extreme events. When we conduct research to adjust past loss events to present day values, we are in effect asking how much damage would occur today if events of the past occurred with today’s level of population and economic development.
For example, according to the National Hurricane Center, in 2005 Hurricane Katrina caused $80 billion in damage (in $2005, what’s known as current dollars as opposed to inflation-adjusted, dollars) and in 2012 Superstorm Sandy caused an estimated $65 billion (in 2012 dollars). The scale of these numbers should makes some intuitive sense to us in 2022.
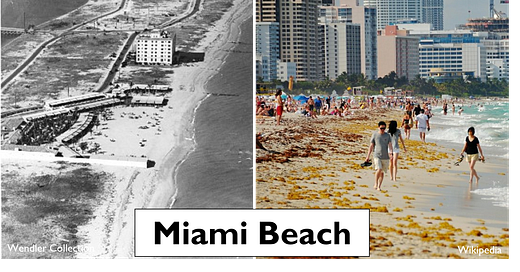
But consider the Great Miami Hurricane of 1926 (which hit the Miami Beach picture at the top of this post). It caused $76 million (in 1926 dollars) in damage almost 100 years ago, or about 1% of the damage caused by Katrina. That number makes little sense, because that same ferocious storm hitting downtown Miami today would surely cause much more damage than either Katrina or Sandy. But exactly how much damage would that 1926 storm cause if it were to hit Miami today?
The answer to this question has great relevance to insurers and reinsurers (those companies that provide insurance to insurance companies), policy makers, and residents of hurricane-prone regions. An entire area of financial analysis called “catastrophe modeling” has developed in the past several decades to address questions like these. This is where normalization methodologies come in.
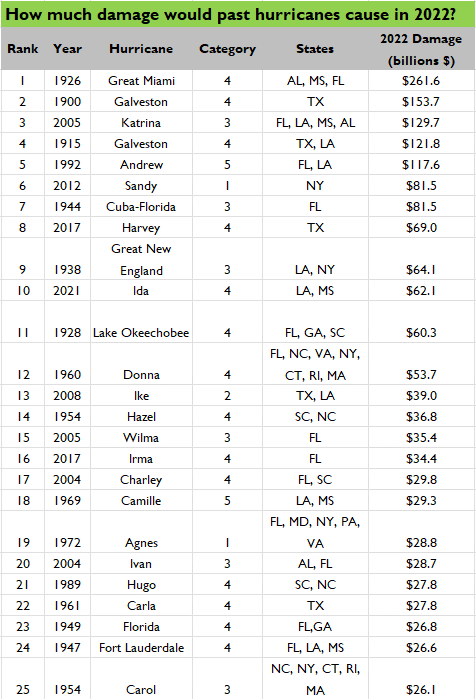
Normalizing the losses for the 1926 Great Miami Hurricane leads to an estimate of more than $260 billion in damage were it to hit in 2022. It is the largest normalized hurricane loss since 1900, based on the damage each hurricane would cause if it hit with today’s level of population and development. The Table below shows the top-25 normalized U.S. hurricanes since 1900, updated from our most recent paper.
The logic of normalization is simple and can be illustrated with an example. Imagine a house on the beach in 2005. A hurricane comes through and badly damages the house, causing $100,000 in damage (adjusted to 2022 dollars). Now imagine that same stretch of the beach seventeen years later, in 2022. Now, due to coastal development there are now two identical houses on the beach. A hurricane of the exact same strength as the earlier storm blows through and damages both houses. The 2022 storm causes $200,000 in damage.
In this hypothetical example, storm damage has doubled over 17 years. However, the increased damage was not because of stronger or more frequent storms. The increase in damage was entirely due to the doubling of the amount of exposed property.
We would be able to recognize the reason for the increased losses by looking at the data and asking how much damage the 2005 storm would have caused in 2022. In this simple example, we would simply multiply the 2005 losses by two 2 to arrive at our answer, because there is twice as much exposed property. The 2005 storm, had it occurred in 2022, would have caused $200,000 in damage. Because we have assumed identical storms in this simple example, the only variable that changes is the exposure to damage.
In the real world however, things are not so simple. Most obviously, houses are built using different practices. So let’s consider an alternative scenario. In this second scenario the second home is built with greater attention to damage potential, perhaps with reinforcements or a change in style. When the second storm passes through in 2022 there is only $50,000 in damage to the newer home, for a total of $150,000 (that is $100,000 damage to the older home, plus $50,000 damage to the newer, stronger home).
Under this second scenario, how much damage would the 2005 storm have caused if it occurred in 2022? If we were to simply multiply the 2005 damage times by two— reflecting that in 2022 there are now two houses — we would get an expected loss of $200,000, which is much higher than the $150,000 that is actually observed. We see a bias in our results because we failed to account for the stronger house of 2022. It would be erroneous to claim from these data that a weaker hurricane occurred in 2022 because of the lesser damage. Don’t use economic damage to make conclusions about climate. By comparing trends in damage to trends in storm frequency and intensity, we can check for evidence of a bias in the results of our normalization adjustments.
Now consider a third variation on the thought experiment. In this version, imagine that there are two houses on the beach in 2022, both identical to the single house present in 2005. In this case, a stronger storm makes landfall in 2022, causing $250,000 in damage to the two houses. In this case, after adjusting the 2005 damage to 2022 values, we would see that the normalized damage from the earlier storm was expected to be $200,000, but we observed $250,000 in total damage. In this case, part of the increase in damages would be attributable to an increase in storm strength. We would then confirm the increase in storm strength by looking directly at climatological data.
Of course, our coasts have trillions of dollars in property across many millions of structures. Hundreds of storms over many decades create a complex record of damages and costs. Implementing a normalization method properly requires paying careful attention to the many societal factors which influence losses, but also to trends in the frequency and intensity of storms.
It seems obvious — but is often overlooked — that in order for climate change, human-caused or otherwise, to result in increasing disaster losses, extreme events must become more frequent, more intense, or both. With more frequent or intense events, we would expect to see similar increases in normalized losses. Because data on the frequency and intensity of extreme weather events are usually collected separately from dollar losses, these two independent types of data provide a very important consistency check for the results of any normalization.
Trends in each dataset should be consistent. If they are not, then there remains something to be explained in the data. I’ll illustrate this in a post to follow, but the logic here is simple: Trends in normalized losses should match up with trends in the relevant weather events.
It is important to emphasize that we do not look at normalized loss data in order to identify changes in extreme events or to discover a “signal” of climate change. The best place to look for evidence of changes in the frequency or intensity of extreme events is, not surprisingly, with data which directly reflects those extreme events. To understand trends in climate, look at climate data, not economic data.
Coming in Part 2: A look at normalized US hurricane losses
Paying subscribers to The Honest Broker receive subscriber-only posts, regular pointers to recommended readings, occasional direct emails with PDFs of my books and paywalled writings and the opportunity to participate in conversations on the site. I am also looking for additional ways to add value to those who see fit to support my work.
There are three subscription models:
1. The annual subscription: $80 annually
2. The standard monthly subscription: $8 monthly - which gives you a bit more flexibility.
3. Founders club: $500 annually, or another amount at your discretion - for those who have the ability or interest to support my work at a higher level.


