


What Countries Have Decarbonized the Fastest?
You'll be surprised at the top of the table


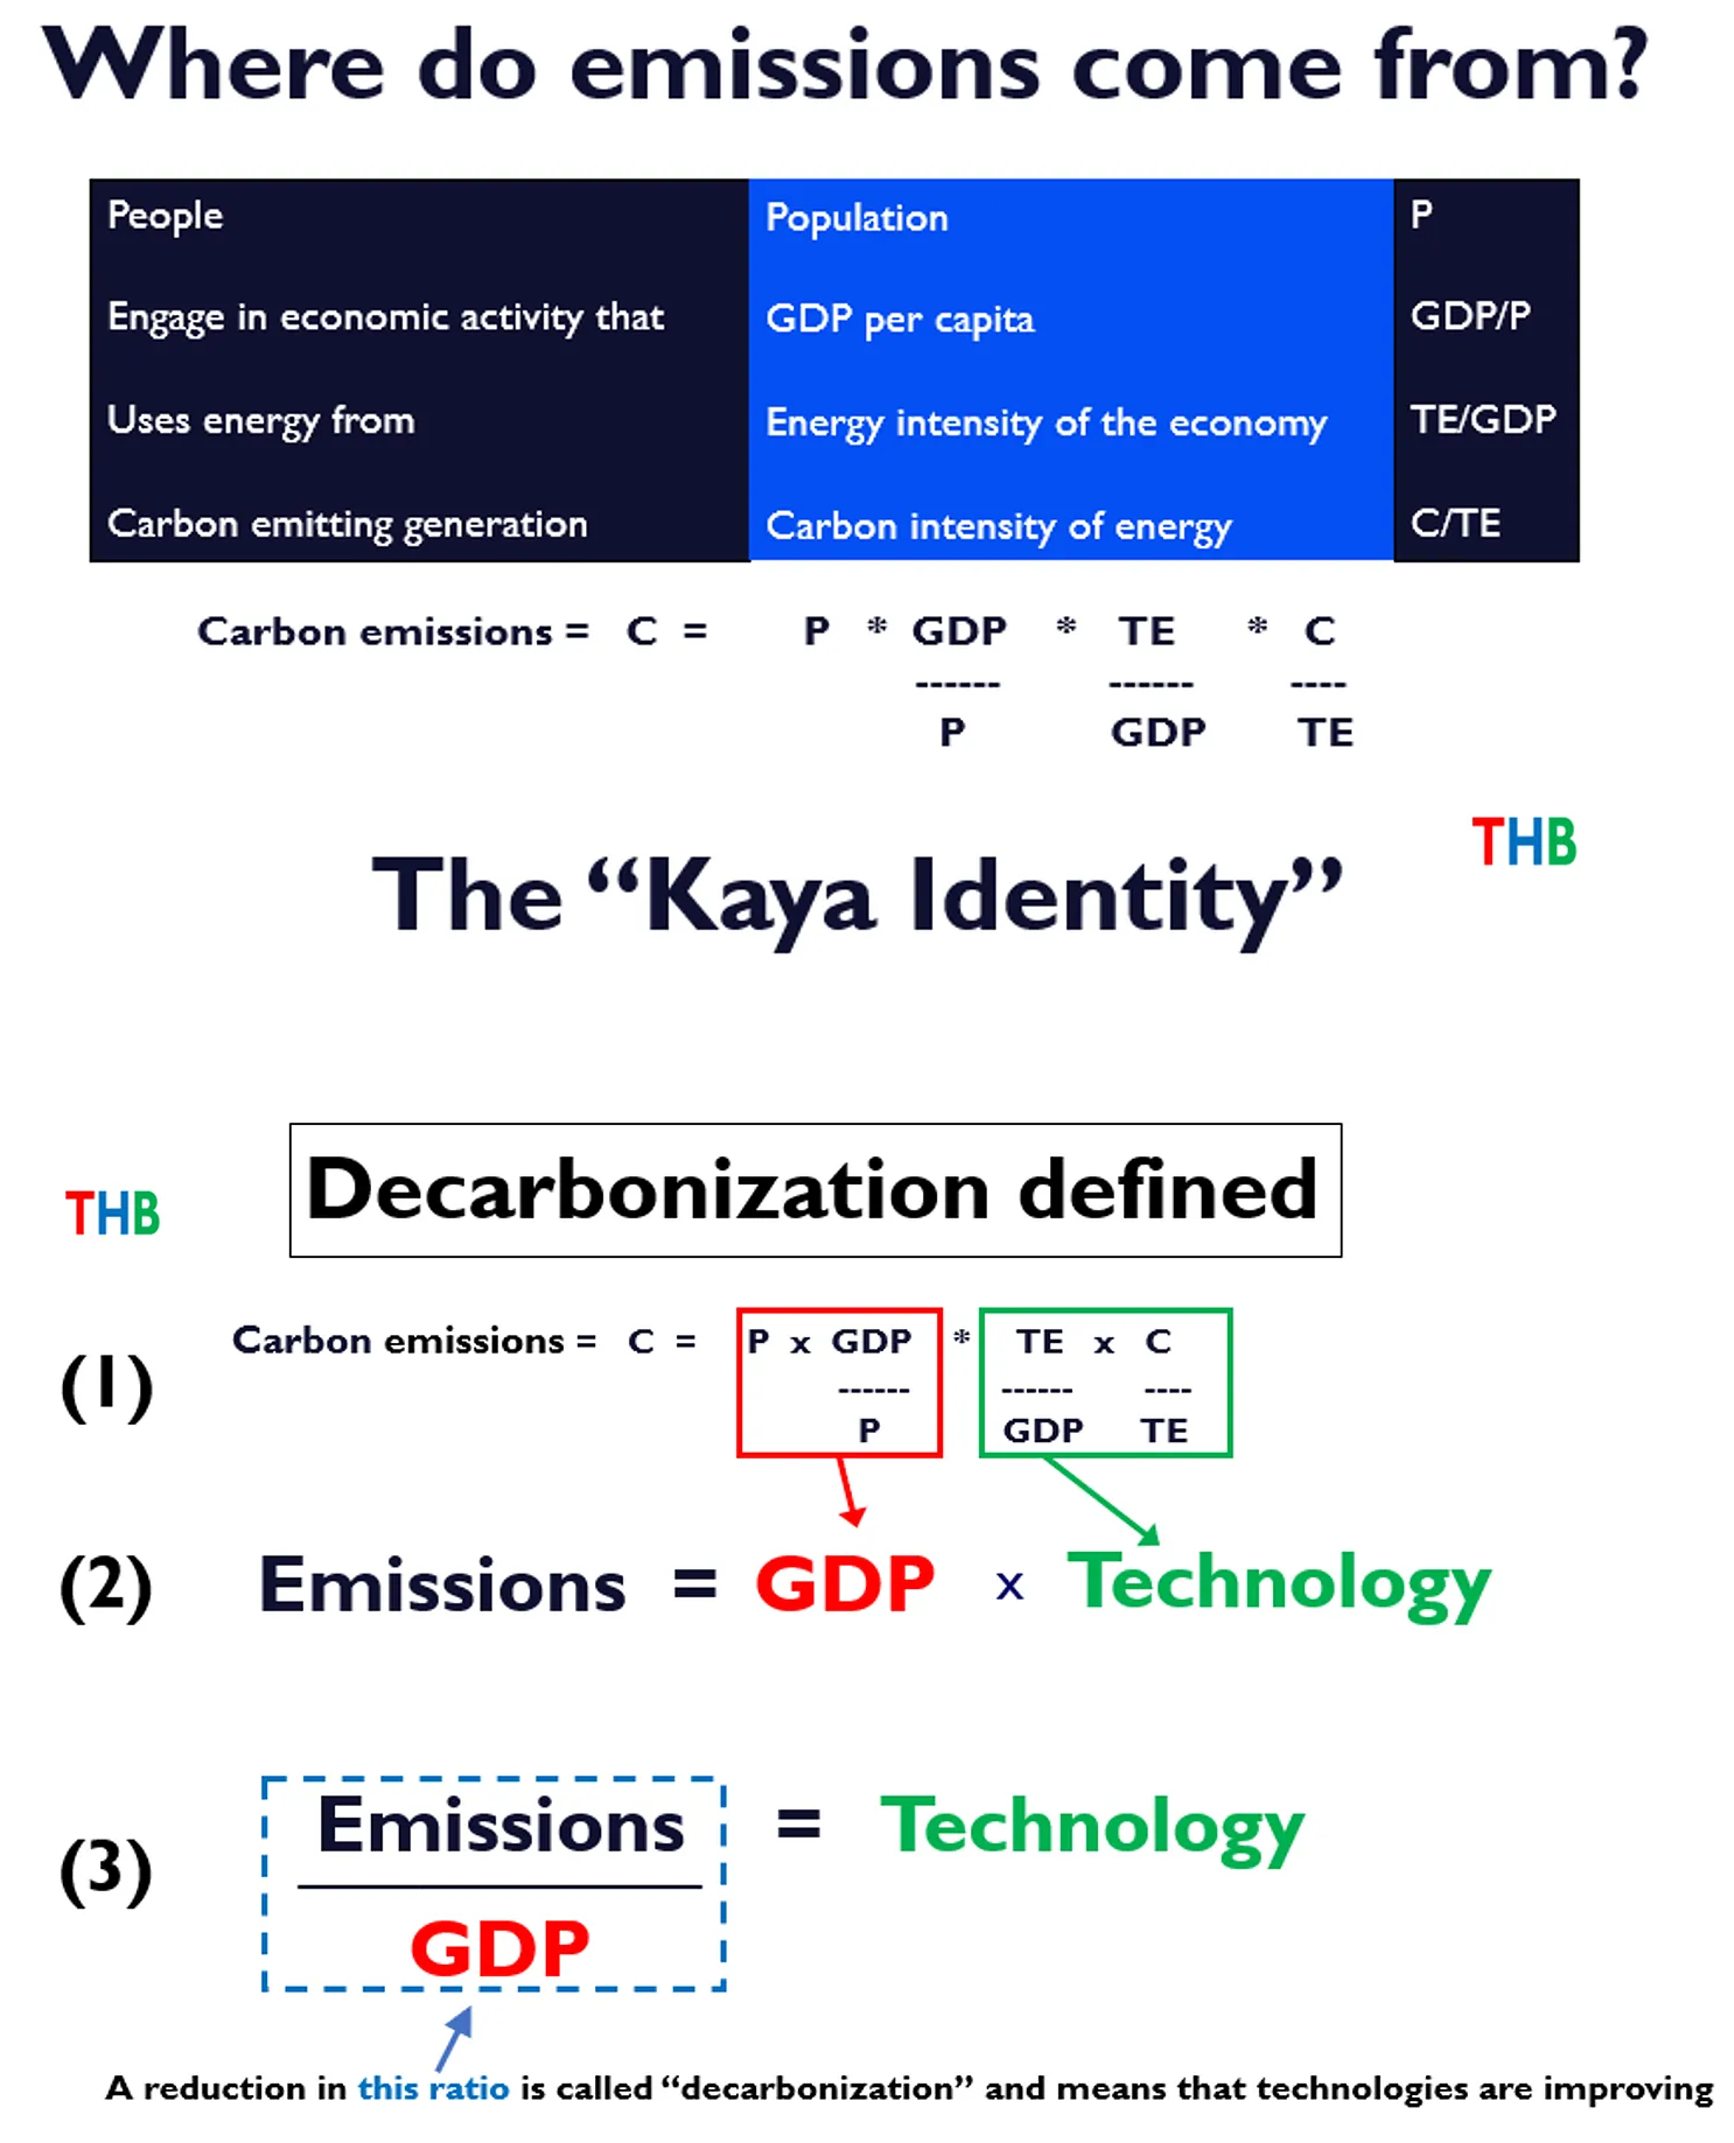
Last month here at THB, I used the “Kaya Identity” to explain the concept of decarbonization, which refers to a reduction in the ratio of carbon dioxide emissions to GDP. I showed data at the global level, which indicates that the world as a whole not only remains far off the pace of decarbonization that would be consistent with the Paris Agreement targets, but that there is little evidence that climate policy is having any discernible effect on decarbonization at the global scale.
The Kaya Identity and decarbonization are defined in the image below. A reduction in the ratio of carbon dioxide emissions to GDP indicates progress in the deployment of technologies of energy consumption and production.
Today I share a deeper dive into decarbonization, looking at specific countries.1 Here is my methodology:
Data on carbon dioxide emissions from energy 1990 to 2022 is from the Energy Institute Statistical Review of World Energy 2023.
GDP data (PPP) comes from the World Bank.
I focus on the top 20 emitters in 2022, who together represent ~83% of global carbon dioxide emissions from energy and ~72% of global GDP.2
I calculate annual rates of decarbonization from 1992, when the U.N. Framework Convention on Climate Change (FCCC) was introduced at the Rio Earth Summit, and from 2015, when the Paris Agreement was adopted.
Below are the tables showing decarbonization rates over these two periods for the 20 countries.

Poland — a surprise to me — occupies the top of the table for 1992 to 2022 and sits at second place since the adoption of the Paris Agreement. Nine of the 20 countries exceed the global average rate of decarbonization in each period, with Brazil replacing Russia in the more recent period since the Paris Agreement. Since adoption of the Paris Agreement, two of these 20 countries are not decarbonizing at all, and instead their economies have become more carbon intensive — Iran and Indonesia.
We can get a better sense of what is going on in individual countries by examining emissions and GDP separately, as shown in the figure below for Poland, the United Kingdom, and China. Note that each figure has a different vertical axis range.

From these graphs we can see that:
Poland’s high rate of decarbonization is a result of its strong economic growth accompanied by a slight decline in emissions, more than tripling its economy with no increase in emissions.
The UK’s higher rate of decarbonization was due to a large (~40%) reduction in emissions since 2007 (due to the 2008 Climate Change Act? Brexit?). The UK would have a significantly higher rate of decarbonization with greater economic growth, which trails far behind Poland and far, far behind China — Although that would raise the question whether higher economic growth would have required greater emissions.
China’s high rate of decarbonization was due to a rate of economic growth that far exceeded its growth in emissions, at a rate of more than 3 to 1.3
No country has achieved rates of decarbonization remotely consistent with the targets of the Paris Agreement, such as net-zero by 2050. To meet aggressive targets for deep decarbonization requires very high rates of decarbonization — Consider that achieving an 80% reduction in global emissions by 2050 implies a rate of decarbonization from ~7% to ~9% per year, for annual global economic growth of 2% or 3%. That is basically a quadrupling of the rate of global decarbonization since the adoption of the Paris Agreement.4
The data shared above does not allow for identifying the possible effects of climate policies on rates of decarbonization, however this dataset will allow us to explore this issue. That will be the subject of a future post.
This analysis is based on methods that I discuss in depth in The Climate Fix, which is available as a PDF here to THB paid subscribers. A focus on decarbonization offers the most straightforward approach to evaluating the effects of climate policies focused on meeting emissions targets.
❤️Click the heart if you are surprised at the top of the table!
I am happy to take requests for analyses, questions about the data and specific countries, and suggestions for approaches that might give us further insight. THB is a group effort and I appreciate your engagement. Thanks for reading and subscribing!
Thanks to Mike Pugh at AEI for assistance with running all the numbers.
Here, I am following the advice of Michael Cembalest who tells us to ignore the PUNIs.
China clearly shows that having a relatively high rate of decarbonization is not enough for emissions to decline — For that to happen requires that the rate of decarbonization exceeds the rate of GDP growth.
Given that this rate of decarbonization has never occurred in a large economy in the 32 years since the introduction of the UN FCCC, it would be fair to ask whether it can be done in the 26 years remaining to 2050 — in the real world, and not in models.
There is a lot to breakdown in that data:
1) The decarbonization rate shown is misleading because it doesn't take into account the reduction in primary energy supply over the same period. This is not decarbonization, this is offshoring of heavy industry to other countries.
As an example UK's 40% drop in emissions 2007 to 2022 is entirely due to a 37% drop in energy/GDP over the same period. Amazing all their investment in renewables essentially had zero effect on their emissions/GDP ratio. I call that a dismal failure of policy.
2) In addition to the above, Poland & Germany's decarbonization since 1992 was largely due to modernizing their Soviet era very inefficient, coal based heavy industry.
3) Most likely the emissions data uses the EU/UK standard that biomass is carbon neutral. Which, of course, is false and indeed ridiculous. The EIA lists carbon emissions of biomass electricity generation @ 1400gms/kwh, vs bituminous coal @ 1100gms/kwh and ultra-supercritical coal @ 700gms/kwh. Take that fact into account and Britain & Germany have been going backwards.
4) The best TRUE emissions reductions, that is taking into account TPES reductions, are going to be found in circa 1976-1989 with the big Nuclear expansions in France, Sweden, Belgium & the USA. With Sweden achieving 650 kwh/capita of avg annual nuclear expansion over the 1976 to 1986 period. Whereas the fastest Germany did with wind & solar was 80 kwh/capita, which is illusory, since intermittent wind & solar are not a direct replacement for fossil electricity generation, unlike nuclear & hydro. In fact Sweden actually did achieve an average of 6% reduction in emissions/GDP in the electricity sector over the decade using nuclear energy. Not far from the target 9%.
https://environmentalprogress.org/big-news/2017/11/7/the-power-to-decarbonize
5) China's reductions in Emissions/GDP is largely due to massive hydro expansions during that period since 1992, as well as a much higher proportion of its manufacturing switching from heavy industrial.
6) The main effort since 1992 on decarbonization has been on vast expenditures (over $5 Trillion) on wind & solar electricity generation. But the data indicates that has been a total failure, there is zero correlation of wind + solar grid penetration and the carbon intensity of each of 62 nations surveyed. Whereas there is strong correlation with both nuclear & hydro grid penetration. For obvious reasons:
https://tinyurl.com/the-power-to-decarbonize
Dr. Pielke ==> Using GDP/PPP is fair enough -- but readers should be aware of the definition of GDP/PPP used by the World Bank: "GDP is the sum of gross value added by all resident producers in the country plus any product taxes and minus any subsidies not included in the value of the products. "
This means, if I am not mistaken, that simple de-industrialization alone could account for the "decarbonization" -- shifts to service industries for your value added (as we have in the United States).
One of my careers was in the IT business -- developed at least one multi-million/billion dollar product using no more energy -- think carbon -- than my own household. That's value-added service industry GDP.
Far different than building cars from domestic steel.
China, on the other hand, has [visually] quadrupled emissions while increasing GDP/PPP by 12 times. Are they just adding non-industrial services as well as increasing in industrialization?
The United States makes the Top Ten but at what cost? Out-sourcing carbon-intensive industries to other nations?
Focusing on "de-carbonization" may mean wrecking both economies and, if one accepts the dominate CO2-Warming hypothesis, the planet as well.