Is Global Climate Policy Working?
Climate policies do many things, but accelerating decarbonization of the global economy is not yet among them
Climate policies can be mind-numbingly complicated, technical, and obscured by specialist jargon. Today, I am going to introduce you into an incredibly powerful, yet simple, approach to evaluating the performance of global climate policies aimed at decarbonizing the global economy. The results are sobering.
We start with the “Kaya Identity.” Formulated in the 1980s by Yoichi Kaya — pictured below in a photo I took in 2018 in Tokyo — the Kaya Identity operationalizes the IPAT formulation, which holds that environmental impacts (I) are a result of the interactions of population (P), affluence (A), and technology (T) — hence, I = PAT. The Kaya Identity was originally developed to facilitate climate scenarios and projections, but it also turns out to be a very powerful tool for climate policy evaluation.
The Kaya Identity has four elements, which I characterize for my students using the following mnemonic:
People engage in economic activity that uses energy from carbon emitting generation.
If you can remember that single sentence then you are well on your way to performing mathematically rigorous climate policy evaluation. We can turn parts of that sentence into four variables:
P = Population
GDP/P = GDP per capita = Engage in economic activity that
TE/GDP = Total energy consumption per GDP = Uses energy from
C/TE = carbon (or carbon dioxide) emissions per total energy = carbon emitting generation
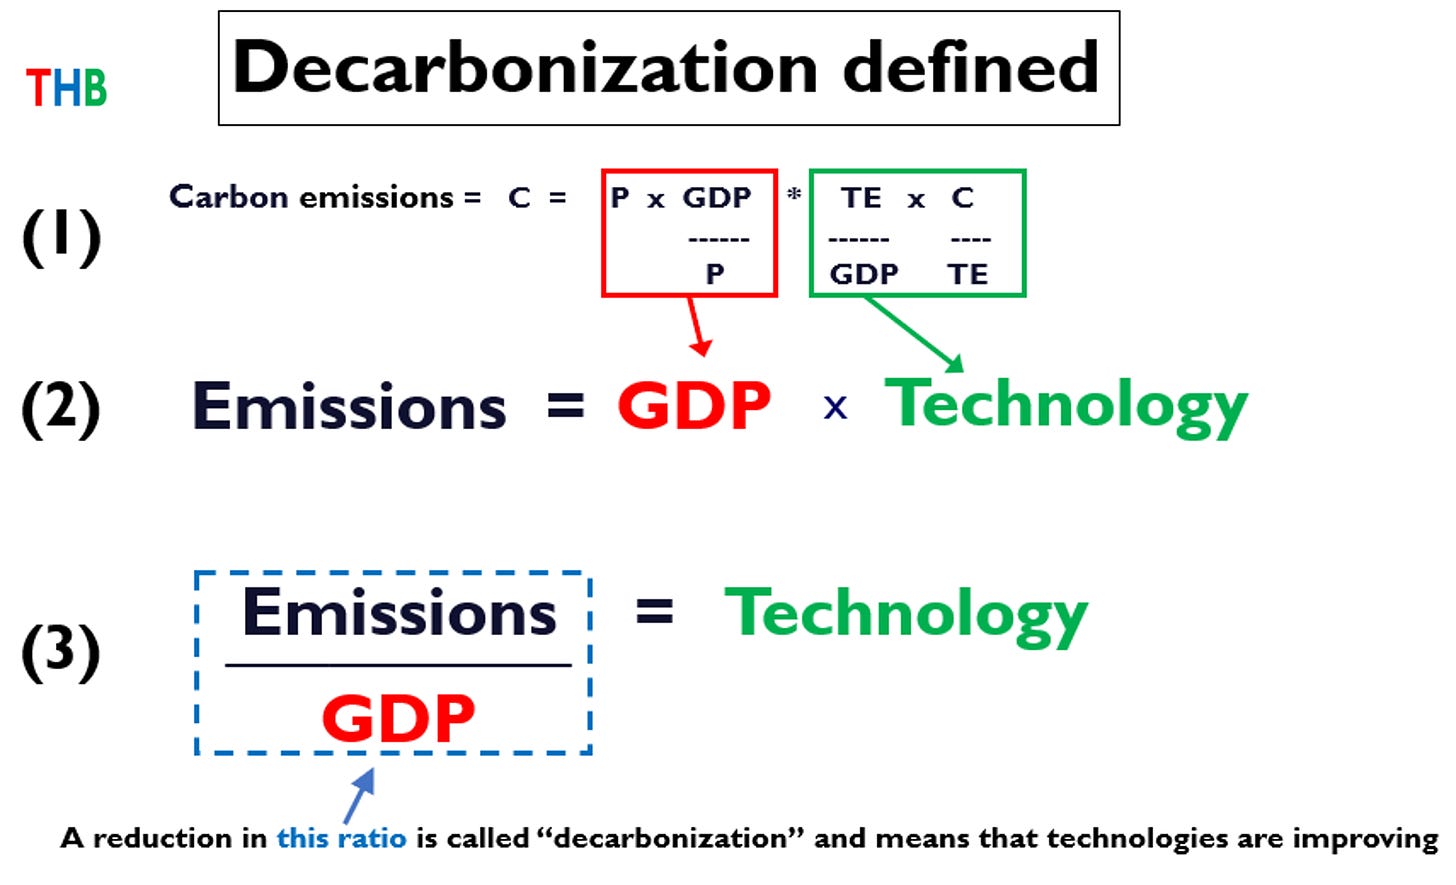
Using these four variables, the Kaya Identity is shown in the figure below.
We can further simplify the Kaya Identity by recognizing that the first two terms — population and per capita GDP — are together just GDP, shown in the red box below.1 The final two terms — energy intensity of the economy and carbon intensity of energy — are together just a result of technologies of energy consumption and projection, or technology for short, shown in the green box below. The figure below shows this simplified version of the Kaya Identity in equations (1) and (2).
We create a blind spot in our analyses when we focus climate policy on carbon dioxide emissions. This might at first seem counterintuitive, after all, if it is carbon dioxide emissions that we want to reduce, shouldn’t we focus like a laser on carbon dioxide emissions?
Well, no actually.
The reason why a narrow focus on carbon dioxide emissions can mislead can be seen clearly in equation (2) above — we want emissions to go down, but we also want GDP to go up. Since these sit on the opposite sides of equation (2), by focusing on emissions, we are missing a key aspect of the dynamics of emissions, and that is economic growth.
Recall 2020, when global emissions plummeted due to the pandemic — Climate policy success, right? No. The reduction in emissions resulted from the economic consequences of the pandemic response, and tell us nothing about climate policy success or failure. Emissions alone do not offer a useful guide to climate policy evaluation on an annual basis because they are a consequence of factors other than climate policies.
A better focus is decarbonization, defined as a reduction in the ratio of emissions to GDP. You can see in equation (3) above that by looking at decarbonization of the economy, we have aligned our mathematics with our incentives. Progress in technologies of decarbonization2 result in a reduction in the carbon intensity of the economy.
So let’s look at some actual data. In this post I am using carbon dioxide data from the Global Carbon Project3 and GDP data from The World Bank.4
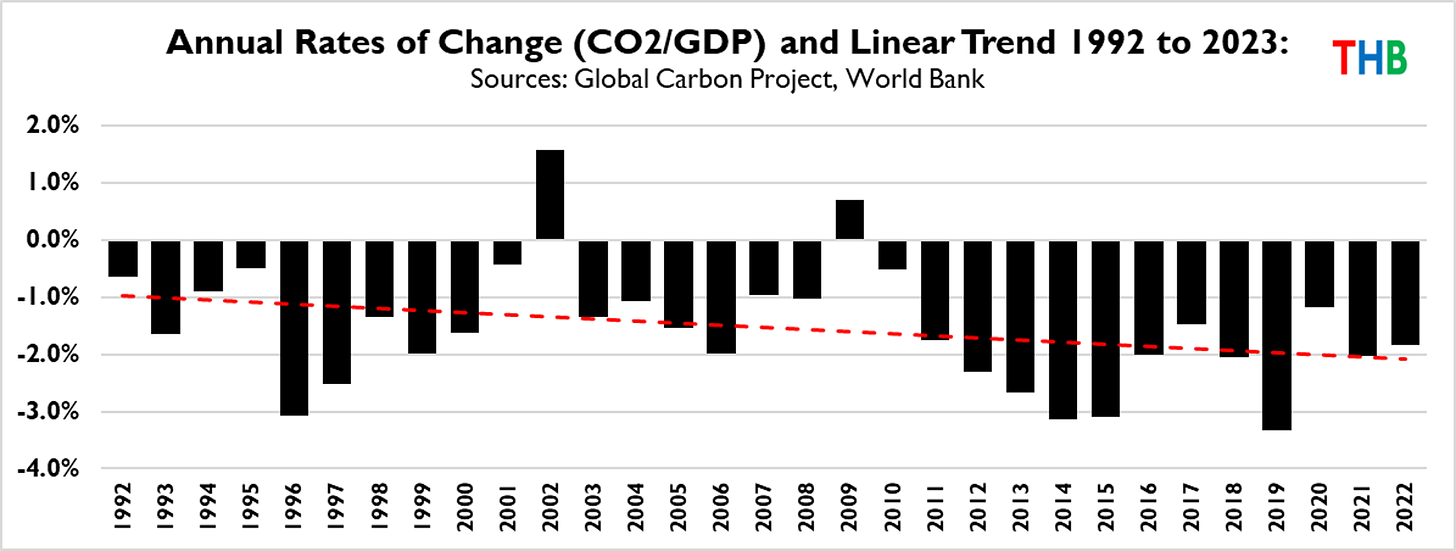
In 2023, the world economy emitted 0.27 tonnes of carbon dioxide for every $1,000 of global GDP. Is that a lot or a little? We can get a better sense of what that ratio means by looking at its change over time. The figure below shows annual rates of change in CO2/GDP since 1992, which was the year of the Rio Earth Summit.
You can see that global decarbonization rates increased since 1992, from about 1% per year to about 2% per year. Over more than three decades, at the global level decarbonization rates doubled.
We can zoom in and look more closely at decarbonization since 2015, when the Paris Climate Agreement was approved, which is shown below.
Since 2015, annual global decarbonization rates have actually slowed down. What ever else climate policies may be doing — and they are doing a lot of things — since the adoption of the Paris Agreement, accelerating the rate of global decarbonization is not among those things.
We can get a better sense of decarbonization progress (or actually, lack thereof) from the following graph, which shows recent rates of decarbonization (black bars) as compared to the annual rates that are implied by setting an emissions-reduction target for 2050 of 80% below 2023 values.5 The red bars show implied rates for two assumed rates of future economic growth, 2.5% and 3%.
To reduce global emissions by 80% by 2050 requires rates of decarbonization of 7.6% per year (assuming 2.5% GDP growth) and 8.5% per year (assuming 3.0% global GDP growth). Since 1992, the highest rate of global decarbonization occurred in 1992 — 4.3% — due to the consequences of the Iraq War. In no other year in the past three decades have annual decarbonization rates even approached 4%, much less exceeded the 7% or 8% needed for deep decarbonization by 2050.
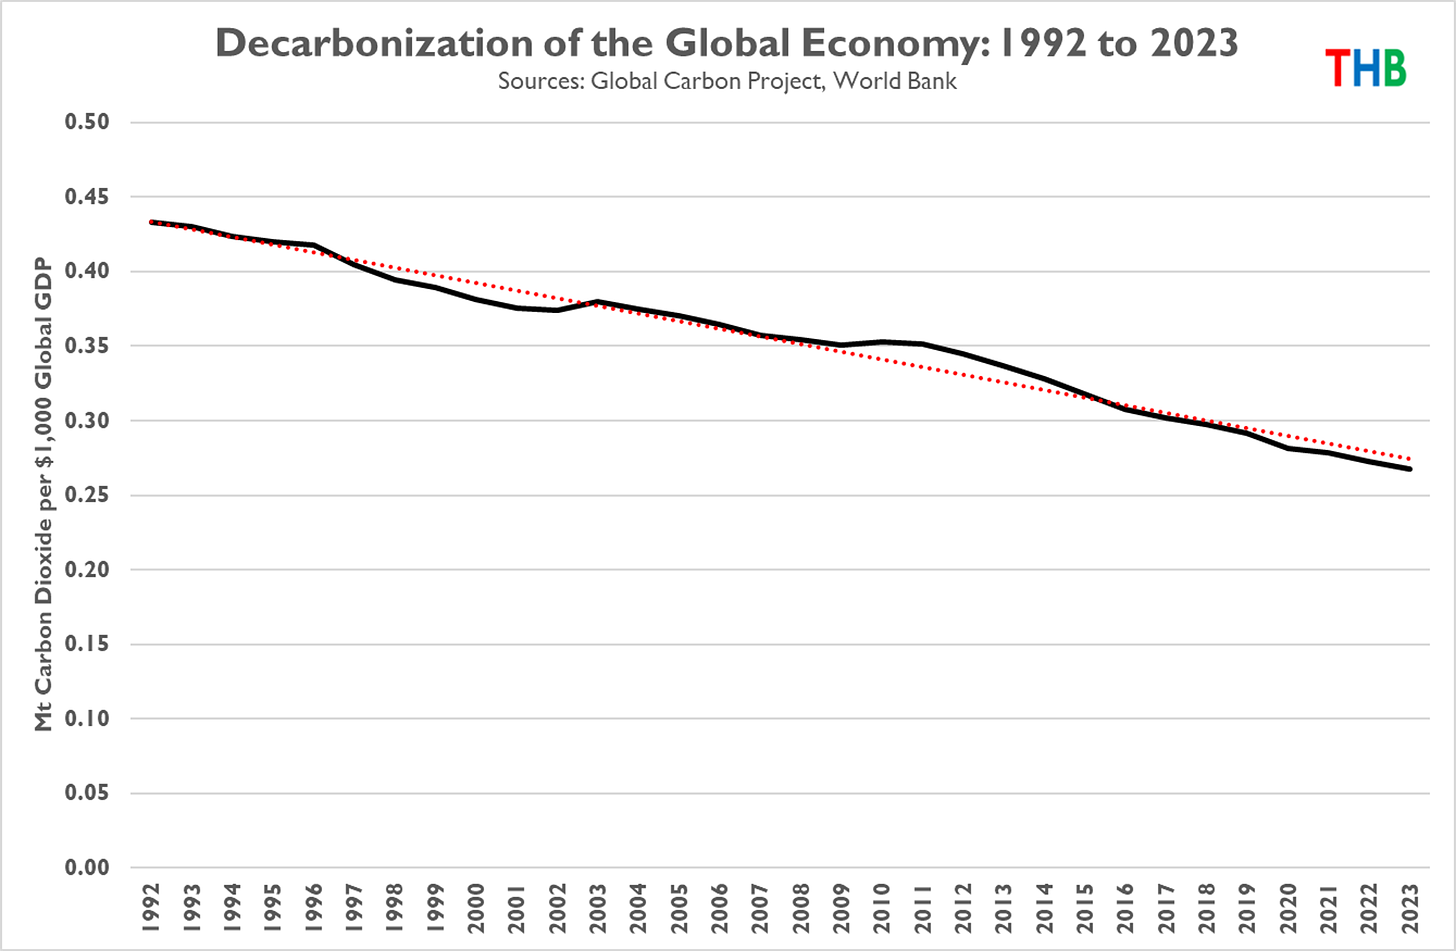
One final figure for today — the graph below shows decarbonization of the global economy 1992 to 2023, with a linear trend shown as the red dotted line. When the black curve dips below the red dotted line, that means that decarbonization took place faster than the trends, and when above the red line, slower.
The graph indicates that as yet, global climate policy since 1992 has not resulted in any meaningful change in rates decarbonization, and certainly nothing remotely consistent with a global transformation of energy systems.6
Despite decarbonization rates falling short of that needed to hit near-term targets, there is a lot of good news in climate policy — the world economy actually is decarbonizing and the most extreme scenarios of emissions growth are now implausible. However, at the same time the policies in place today, and even those proposed, have shown little capability for accelerating decarbonization rates.
That means one of two things will occur — either policies will change to be more effective with respect to targets, or targets will be missed and new, more realistic targets will be created. Pick one.
❤️Click the heart to appreciate the Kaya Identity
Thanks for reading! I appreciate comments, critique and questions. Please share this post with your favorite person interested in climate policy. THB is reader supported — and an experiment in doing independent scholarly work, which means I’m working for you. I appreciate your support that makes my writing and analyses possible.
Readers of The Climate Fix will know that the Iron Law of climate policy comes directly from the Kaya Identity.
In The Climate Fix I explain that in the past, decarbonization has been driven by reductions in the energy intensity of the economy (partially due to improved energy efficiency), but that in the future, deep decarbonization necessarily must be led by decreases in the carbon intensity of energy. This is due to the simple math implied by the Kaya Identity, and I’ll do a post on this before long.
Specifically, I am using the GCP time series for carbon dioxide emissions from the consumption of fossil fuels.
Specifically, I am using The World Bank’s time series for PPP in constant 2017 U.S. dollars. That time series goes through 2022, and 2023 is estimated at 3.0% global GDP growth, following the International Energy Agency.
The results here of a shortfall in decarbonization rates are insensitive to assumptions for the level of deep decarbonization or choice of target date in coming decades.


Roger, I think that some people don’t actually want GDP to go up. But I think that thinking about the model is a great way to ruffle through the discussion and find out where people disagree. For example, you could want to reduce carbon subject to the constraint that a certain standard of living can be maintained in some countries and increased in others. As you talk about “stealth advocacy” there is also “stealth Reduction in quality of life” as perceived by..ordinary human beings. Hence, challenges around siting new energy facilities of whatever decarbonized persuasion (uranium mining, solar and wind, transmission). Or the perceived need for everyone to live in cities and take buses for “the climate.”
Interesting analysis and more up my alley. People involved in the green movement think the world is selfish and greedy. They have their a/c and auto but they don’t want anyone else to enjoy the same luxury. Instead of spending trillions on policies that don’t work how about a Manhattan Project for climate? Science realistically is the only way to accelerate decarbonization. The current technology improves GDP but falls short on reducing the footprint. A really great analysis of the problem Roger.