


End the Week with THB
Global climate policy evaluated with two simple figures

In The Climate Fix I argue that the single best metric of progress on climate mitigation policy is decarbonization — defined as the rate of reduction of the ratio of carbon dioxide emissions to global GDP, otherwise known as the carbon intensity of the economy. Decarbonization is a much better metric than emissions because it explicitly acknowledges that we want GDP to go up and emissions to go down.1
A reduction in this ratio is achieved in three ways, by increasing economic activity, making economic activity less energy intense, and the big one, consuming energy that is less carbon intensive. However, simply reducing this ratio is not sufficient to reduce emissions, much less to reach a specific emissions reduction target. Emissions will only be reduced if the rate of decarbonization is greater than the rate of GDP increase.2
This week The Global Carbon Project release their 2023 Global Carbon Report, an indispensable resource for anyone working on climate. That report includes the figure below — showing carbon dioxide emissions along with the carbon intensity of the economy since 1960. I annotated the figure by drawing the red line that connects 1960 to 2023, which you can see below.

Achieving net-zero carbon dioxide will require that the carbon intensity of the economy to also reach zero. In 2023, the carbon intensity of the economy was about 270 grams of carbon dioxide per dollar of GDP, down by more than half from 1960 when it was >600 grams CO2/USD.
Remarkably, the rate of decarbonization of the global economy has been close to linear since 1960, as you can see in the figure above. When the decarbonization curve ventures below my straight red line that meant that decarbonization accelerated, and when it was above the red line that means that decarbonization slowed down.3
The whole point of climate mitigation policy is to accelerate the rate of decarbonization, meaning to push that decarbonization curve well below its historical, linear rate of decrease.
You do not need to do any math to see that there has been no inflection point in the decarbonization curve in the era of global climate policy. Whatever else global climate policy has achieved, it has not discernibly altered rates of decarbonization from the historical trend since 1960 — Remarkable!
Importantly, if the world continues on the trajectory of decarbonization going forward that it has had since 1960, then we would reach net-zero carbon dioxide by around 2070, which is more or less consistent with a 2 degrees Celsius temperature target.
Maybe rather than accelerating decarbonization, climate policy is simply keeping the world on its historical trend. If so, that would not be such a bad outcome.
We can get further insight into decarbonization by looking at another Global Carbon Project figure that I have similarly annotated. The figure below disaggregates decarbonization into is component parts — GDP, carbon intensity (CO2/Energy) and energy intensity (Energy/GDP).
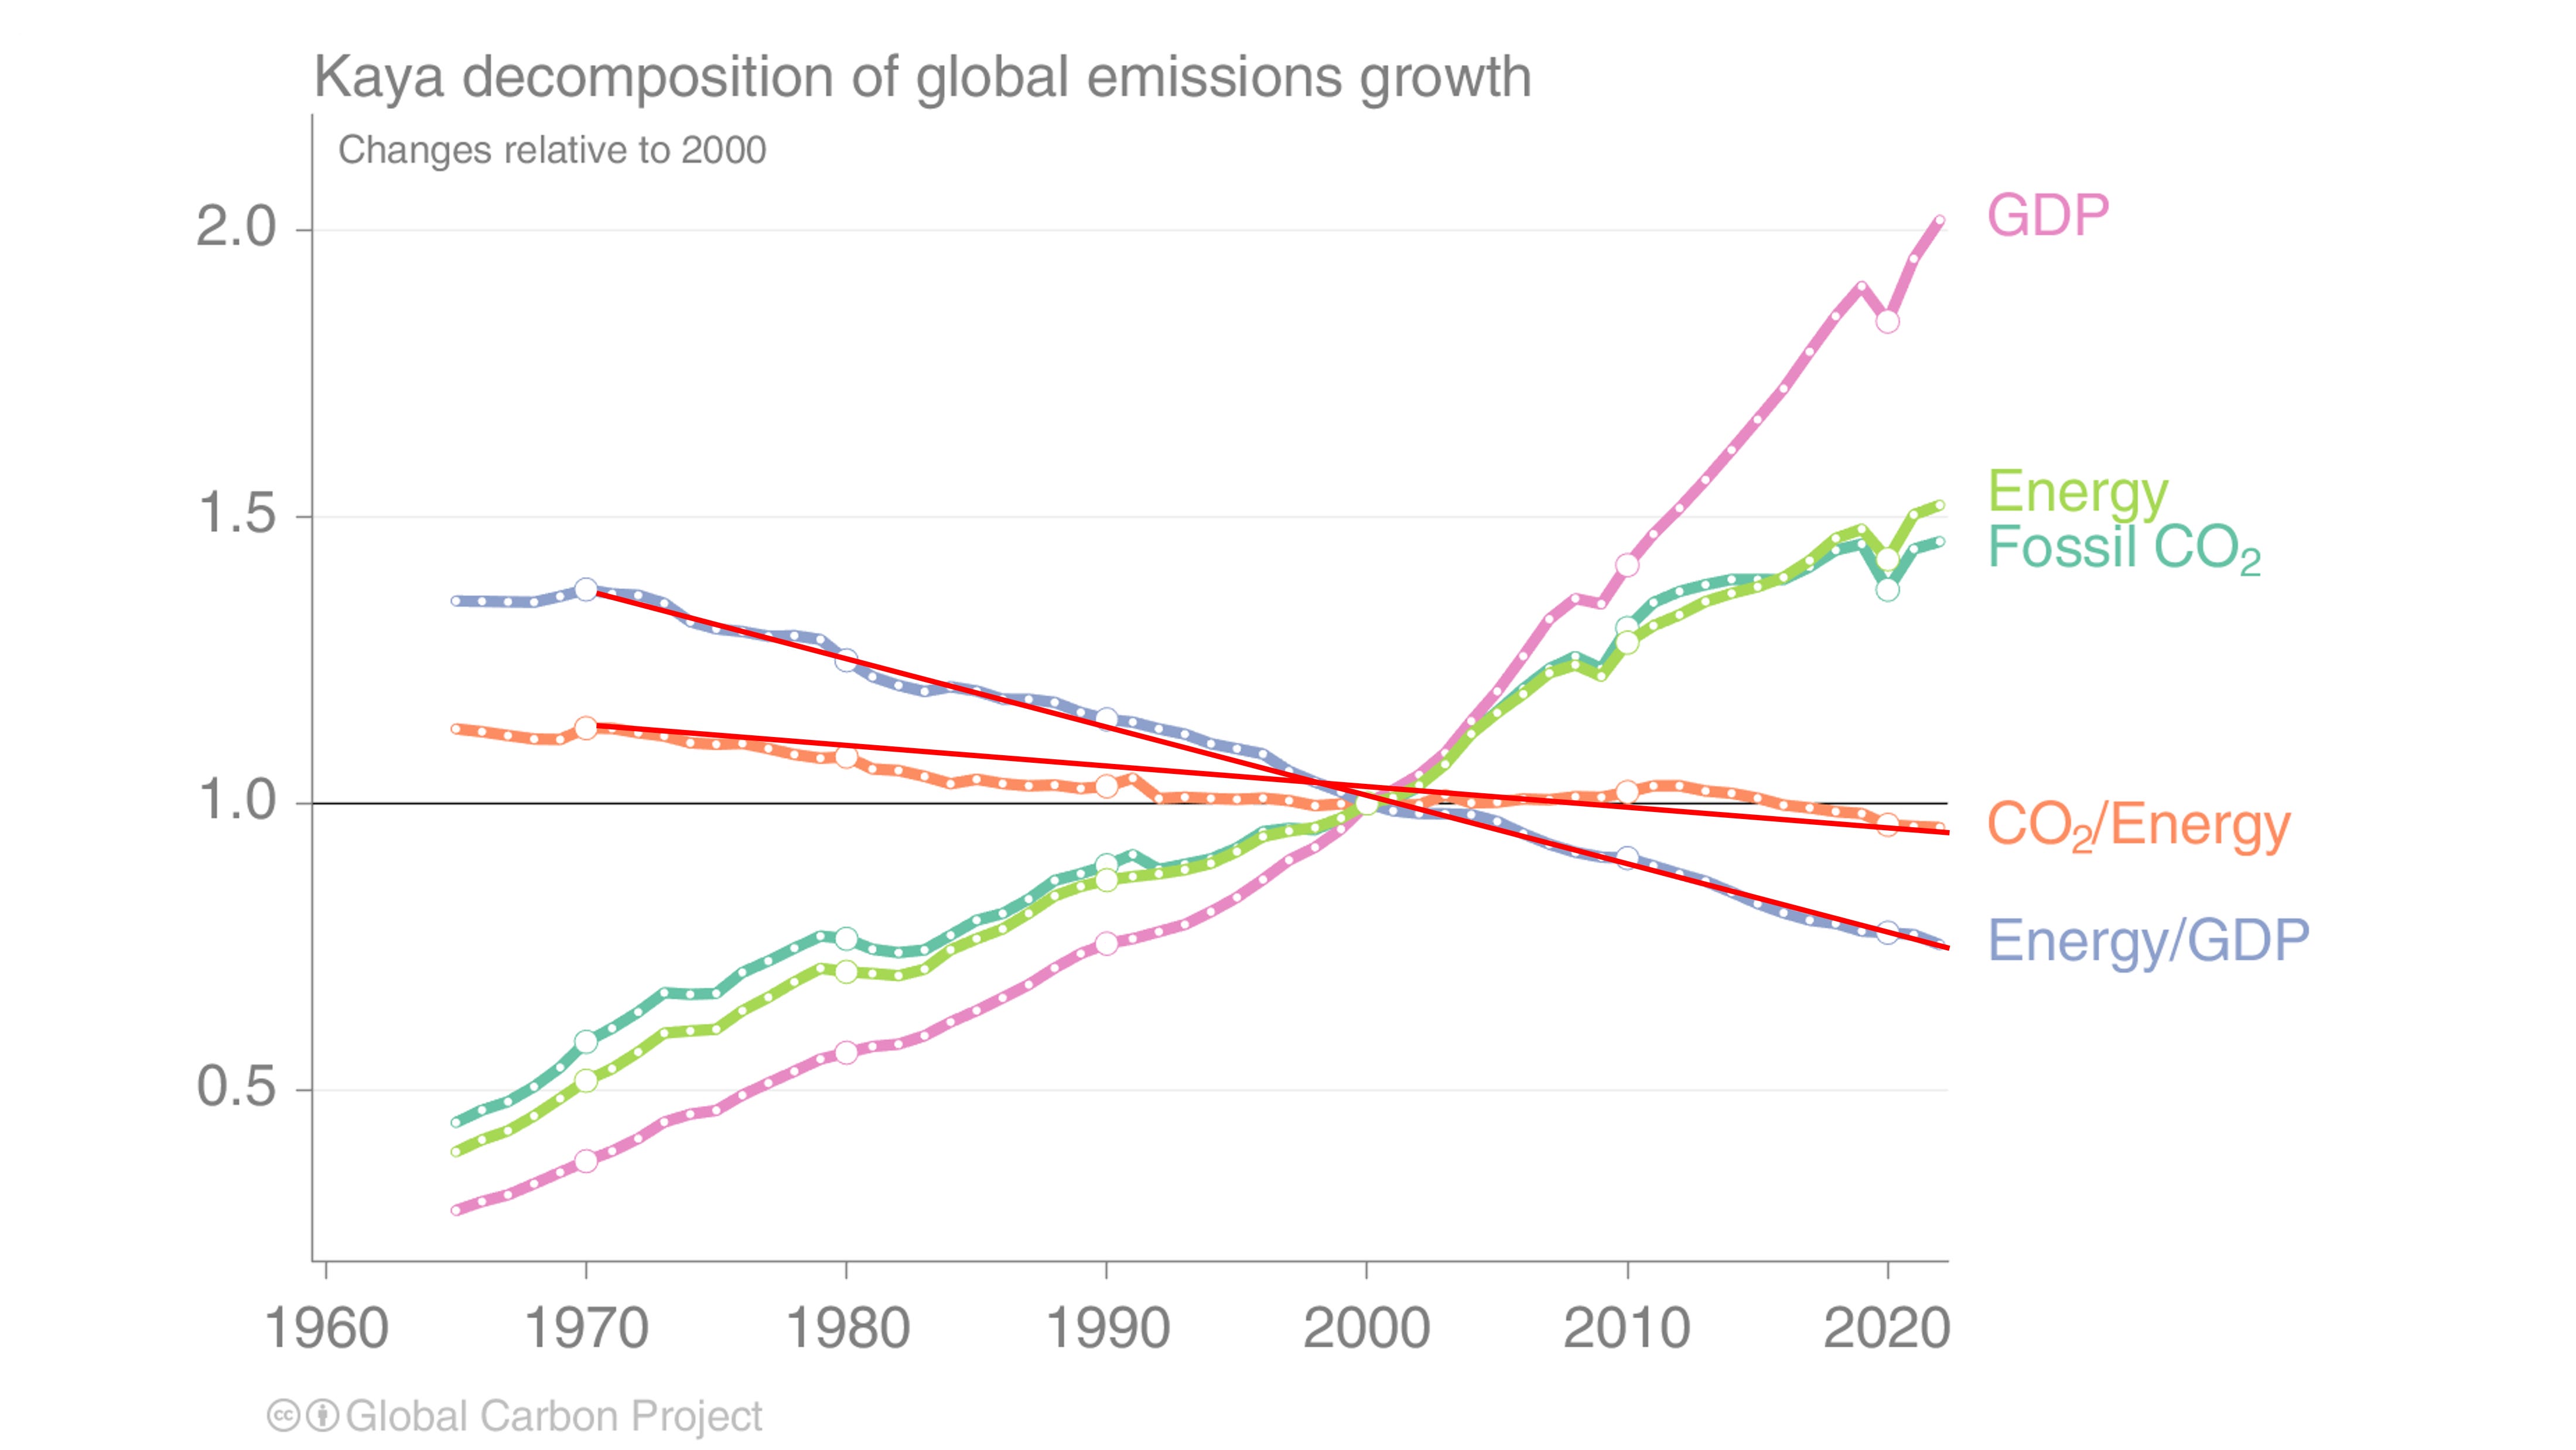
Here, I have sketched two red lines, from 1970 for carbon intensity and energy intensity. The most important of these for accelerated decarbonization is carbon intensity, which has changed little over recent decades, but shows a slight decrease since about 2013.
A few things to note:
Energy intensity decline is almost perfectly linear, with few deviations. Why such consistency over a half century? How subject to policy-motivated acceleration (or deceleration) is energy intensity anyway?
Carbon intensity decreased more rapidly from 1970 to 2000 than it did from 2000 to 2023. That is remarkable, given that reducing carbon emissions has been center stage in the latter period but not the former. I’m pretty sure I know why — and it is spelled N-U-C-L-E-A-R.
In both carbon and energy intensity trends there is no discernible evidence of policy-induced changes in the era of climate policy.
What does all this tell us? I can think of a few things:
When people argue that extreme scenarios are no longer plausible because of the successes of climate policy, they are simply wrong. Extreme scenarios were never plausible in the first place.
The 100,000+ people gathered in Dubai may be doing wonderful things and having much fun, but there is no evidence that their previous 27 jamborees have made a difference on the one variable they profess to care about the most.
But even so, the world’s economy has indeed become less carbon intensive by a great deal over the past 63 years. If that continues, we will indeed achieve net-zero carbon dioxide in the second half of this century.
Maintaining the historical decarbonization trend for the next half-century will not happen by magic or automatically. Continued efforts to improve efficiency (a key element of energy intensity decline) and to decarbonize energy consumption — as that consumption grows dramatically — will require a lot of innovation, investment, policy and hard work.
Maybe just staying on the historical decarbonization trend is climate policy success.
If you want to read more about decarbonization, you are in luck — The Climate Fix book club is available to THB Pro subscribers, and we are so far 7 chapters in, with Chapter 8 coming next week.
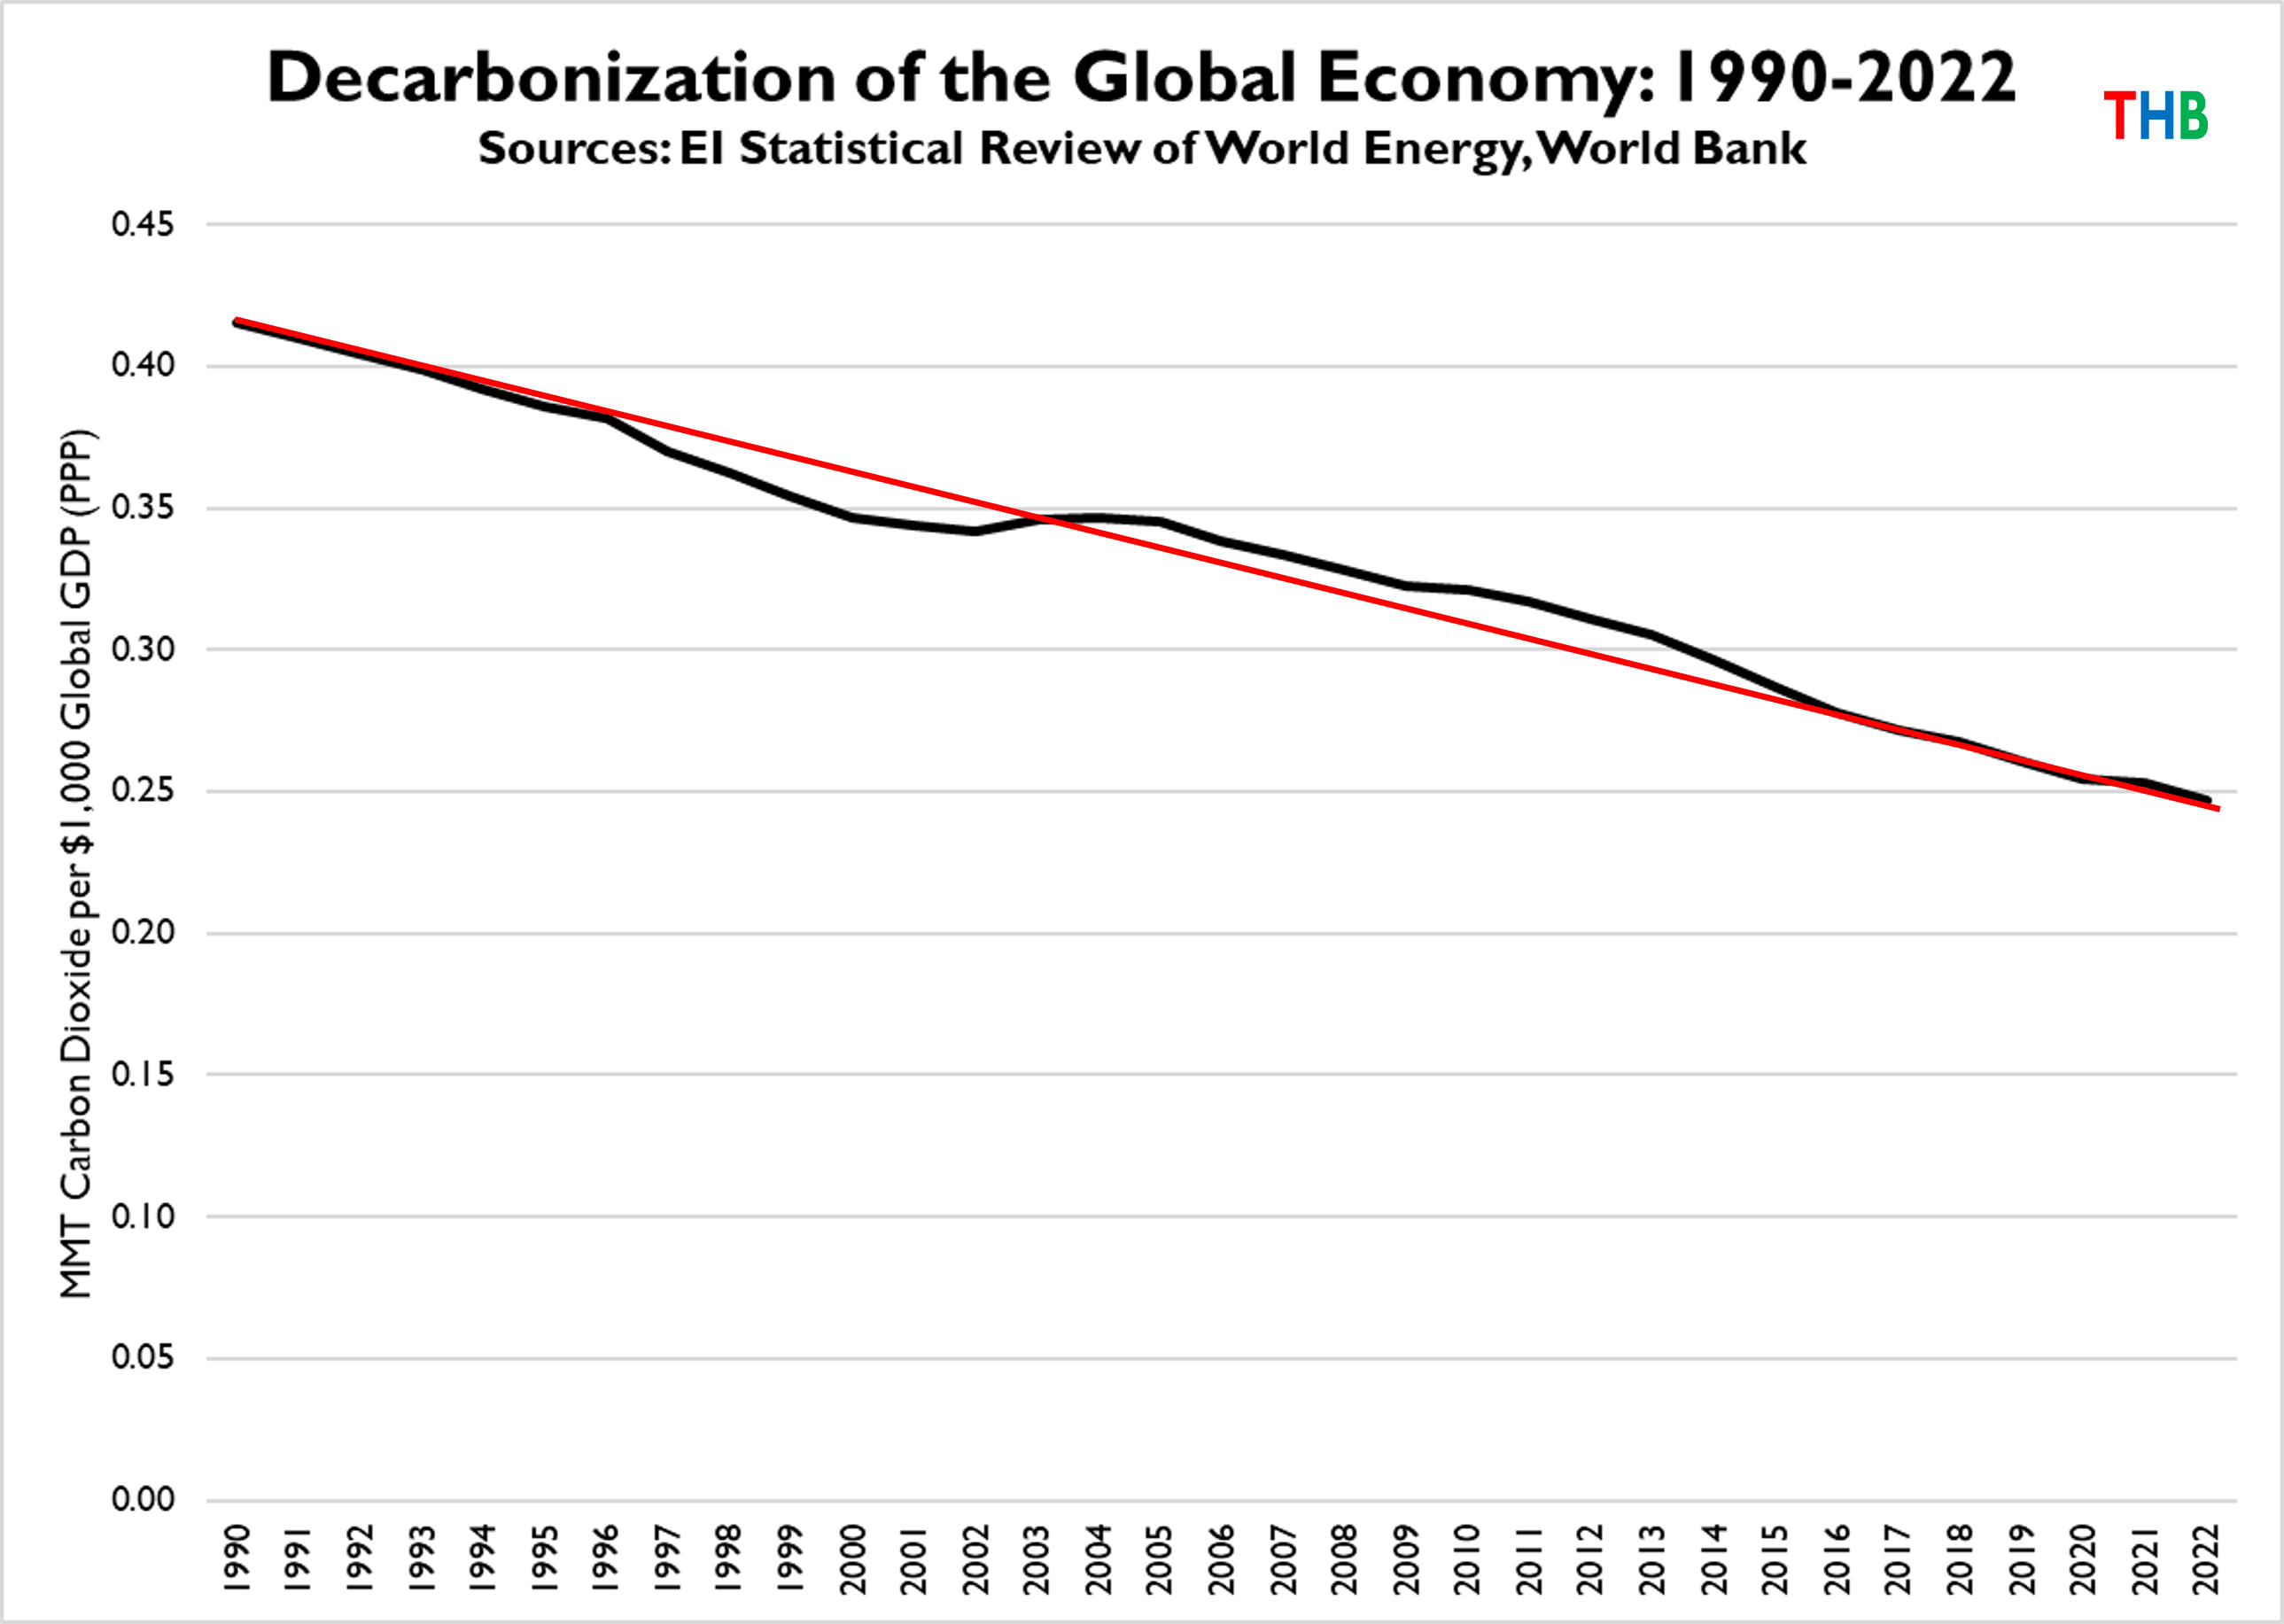
Addendum 9 Dec 23: In the comments questions were raised about the GDP data. I have created an independent graph of decarbonization using World Bank constant 2017 PPP dollars and carbon dioxide emissions from the EI Statistical Review, with a similar straight line added, as above. Here is that graph, showing that the trend is not based on inflation.
Thanks for reading, have a great weekend! THB is reader supported, reader engaged and reader appreciative! Please consider a subscription if you are not already subscribed, and if are already subscribed, please consider upgrading to support my work, if that makes sense for you. Thank you.
Some people think that decarbonization can be achieved by decreasing GDP. They are wrong, it is an iron law.
I won’t get into the details here, but the heavy lifting on accelerating decarbonization can only come from reducing the carbon intensity of energy.
The slowdown in emissions growth in the past few years can be attributed to the slick increase in the rate of carbon intensity decline that you can see on the figure.
Be sure to see the addendum just added to this post
And here is the GDP time series (PPP) used by the GCP:
http://www.cepii.fr/CEPII/en/bdd_modele/bdd_modele_item.asp?id=17
"I won’t get into the details here, but the heavy lifting on accelerating decarbonization can only come from reducing the carbon intensity of energy."
The only realistic way to decrease "carbon intensity" is through the use of nuclear energy and possibly hydro power. Other "renewable" sources of energy acceptable today are wind and solar, which are exceedingly inefficient, wildly unpopular where they have been forced on a population , and they are utterly irrelevant in view of the determination of Third World countries to continue using fossil fuels. In fact the Third World's continuing use of FFs is the reason the world has continued to increase levels of CO2 in past decades (concomitant with gratifyingly greater prosperity) despite trillions of dollars spent by western nations on increasingly rejected and hated renewables. They cost too much, they don't work, and our economies are being hijacked by an ideology that is increasingly rejected by the people.
And what are our governments saying to this ? That we, western and prosperous powers , must keep going on this self-destructive transition to unreliable sources of energy because this is somehow going to set an example for the other nations. Well clearly It isn't working, because it doesn't work. Nobody in the Third World is serious about transitioning from FFs, and no one in America is serious about nuclear energy, the only realistic answer to both lower COP2 emissions and continued prosperity. To quote you (Roger Pielke Jr, ), "Whatever else global climate policy has achieved, it has not discernibly altered rates of decarbonization from the historical trend since 1960 — Remarkable!"
Another of your quotes is : "the world’s economy has indeed become less carbon intensive by a great deal over the past 63 years. If that continues, we will indeed achieve net-zero carbon dioxide in the second half of this century." How has this happened? Correct me if I am wrong, but mainly by using natural gas and other fossil fuels with lower emissions, and yet this has also been in lockstep with increasing CO2 emissions and without sacrificing our prosperity.. .Yet the global elites insist we must give up FFs if we are ever to achieve "Net Zero". Why is it that our progress is simply not good enough - because we still use FFs? And why should we accept "Net Zero" when our competitors do not?
It is a travesty that the progress made by the US in lowering CO2 emissions through the use of NatGas (which could also work in Europe) is not good enough in the eyes of the COP-whichever-number -- and perhaps in your eyes also - and is passed over as not good enough because the progress was made using a superior species of FFs. I guess I simply fail to see why you are so committed to Net Zero when it is so detrimental to our future and when it is clearly rejected by the poorest countries who will not sacrifice their futures to a Western ideology that cost too much and makes us poorer.