
Every year for the past 14 years, Michael Cembalest of JP Morgan publishes an annual energy paper rich in data and analysis. Last week JP Morgan published the 2024 edition and today I share five important figures from the hundreds in the report, which I highly recommend.
Is the IRA Already Behind in Achieving its Promised Emissions Reductions?
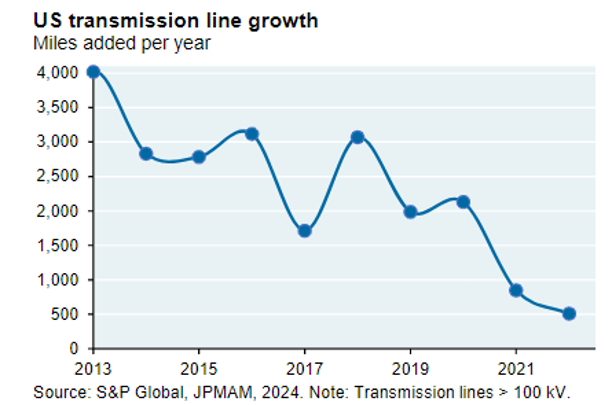
The figure above show annual additions of U.S. high voltage transmission lines from 2013 to 2022. In 2023 additions totaled about 250 miles. One of the main spreadsheet models used to promote the Inflation Reduction Act (IRA) assumed that 2024 would see 2,600 to 4,100 miles of new transmission, with the pace of deployment increasing in following years. According to FERC, through mid-2026 deployment is expected to occur at a rate of ~440 miles per year. Time to update the spreadsheets!
Future Energy Demand: Take the Over
The New York Times reported yesterday:
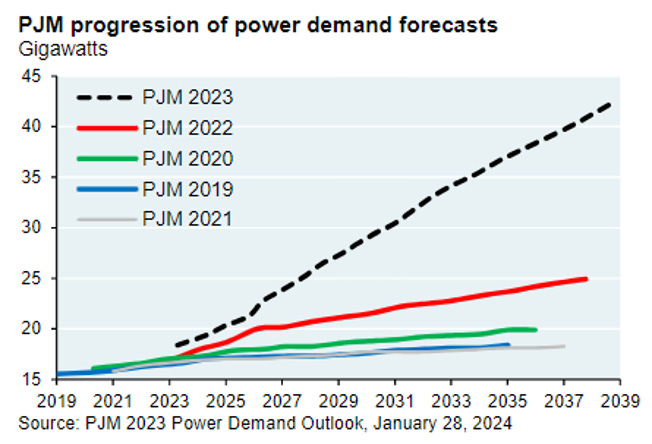
PJM Interconnection, which oversees the nation’s largest regional grid, stretching from Illinois to New Jersey, is now expecting an additional 10,000 megawatts of demand by 2030 that wasn’t forecast last year. That’s akin to adding another New York City to the system.
In the figure above Cembalest shows how quickly expectations have changed for increasing electricity demand. We should expect these increases to continue — pretty much everywhere and for a long time.
It is Difficult to Imagine the Scale of China’s Energy Consumption
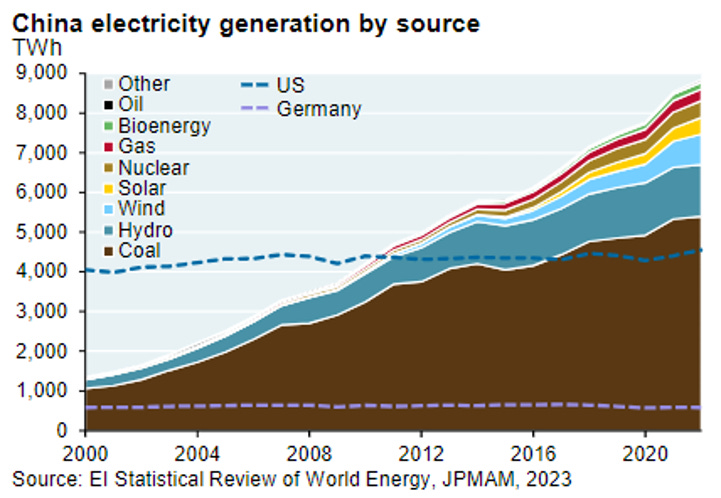
Everyone knows that China produces a lot of energy and that much of it comes from coal. The figure above is helpful in visualizing just how much electricity China produces and where it comes from, and how it compares to U.S. and Germany electricity generation. In 2000, the U.S. produced four times the electricity of China. By 2022 China was approaching electricity production twice that of the U.S. — Germany? Tiny in comparison. Watch this space — China (and India and eventually the African continent) will see continuing increases in energy demand far into the future.
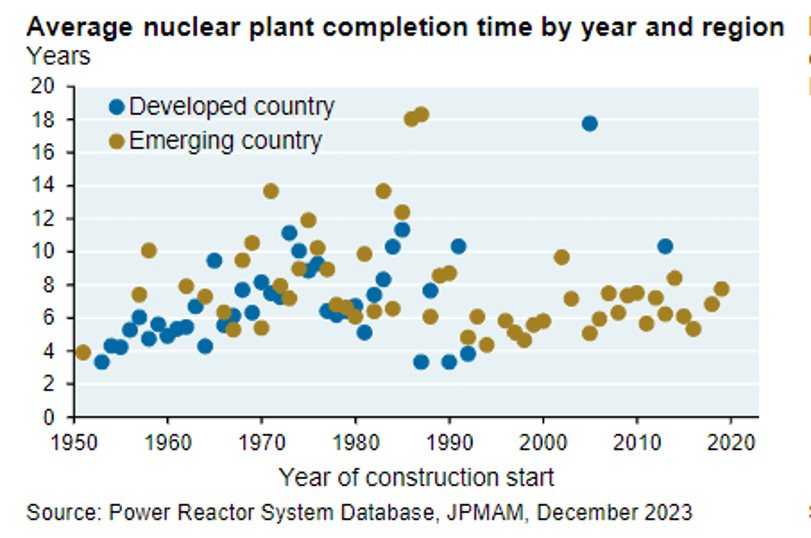
Not as Long As You Might Think
Most nuclear plants built this century were completed in less than eight years. The exceptions are two plants built in developed countries. Cembalest warns: “Plants have been completed in 6-8 years in developing countries such as China, India and Russia but this has nothing to do with what can be accomplished in the West.”
Ignore the PUNIs
Cembalest explains:
While China merits the attention it gets on its energy transition, some very small countries do not. One example: press articles on the high share of renewable power that some countries generate in one hour or one day of the year without mentioning how the rest of the year’s energy needs are met. Or: articles highlighting renewable transitions in countries with unique natural resources without acknowledging that they’re often irrelevant to the rest of the world. The acronym “PUNI” refers to Panama, Uganda, Norway and Iceland, prime examples of this phenomenon.
You can read the 2024 JP Morgan Annual Energy Paper in full here.
Thanks for reading! I welcome your comments, discussion, tips and pointers. THB is reader supported — Your support at any level is appreciated!




Roger, if you are in London April 13 I cadged a ticket for the arsenal fixture with Aston Villa.
I’ll probably have to skip a mortgage payment as a result but there you go
😀
Jigar Shaw who runs the Department of Energy loan office mentioned on a great Volts podcast episode with nuclear skeptic David Roberts that the spreadsheet energy model requires 3x transmission and 1.7x is currently optimistic
Clean firm power is needed and nuclear is the proven option. I can't imagine a transmission turnaround that isn't extremely politically disruptive