Take the Under
What do downward-revised population and GDP projections mean for climate futures?
In the Financial Times over the weekend, John Burn-Murdoch discussed how projections of global population keep decreasing:
The UN’s latest central estimate forecasts that the global population will peak at 10.3bn in 2084. The IIASA puts the peak at 10.1bn in 2080, and IHME at 9.7bn in 2064.
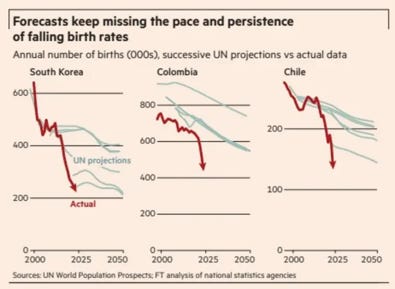
But, one after another, the forecasts keep missing, repeatedly underestimating the pace and duration of falls in birth rates. To give one example, just five years ago the UN estimated that there would be around 350,000 births in South Korea in 2023. There were actually 230,000, more than a third fewer.
South Korea is almost too lazy an example in demographic discourse, but similar misses are increasingly common. Jesús Fernández-Villaverde, professor of economics at the University of Pennsylvania and a prolific researcher on the intersection of economics and demography, highlights Latin America, where the official birth tallies in country after country are falling far short of forecasts.
Last year in Colombia there were 510,000 births, a 22 per cent decline over five years, and around 30 per cent lower than even the UN’s nowcast for that same year.
Burn-Murdoch concludes:
[T]hese estimates are extremely fuzzy and based on frameworks that were true in the past but may not be today. Use them with caution, and probably err on the low side.
Given how important population projections are for climate scenarios, and the well-understood fact that climate scenarios are out of date, Murdoch’s column got me thinking — What are the implications for climate projections if we do “err on the low side”?
Today’s post provides an answer, and it is significant.
As a starting point, I focus on so-called “current policy” projections — that is, projections based on policies that are in place today — of global temperature increases by 2100. Last week, Carbon Brief presented three different “current policy” projections shown below in the red box (which I added), on the occasion of last week’s release of the UNEP Emissions Gap Report.
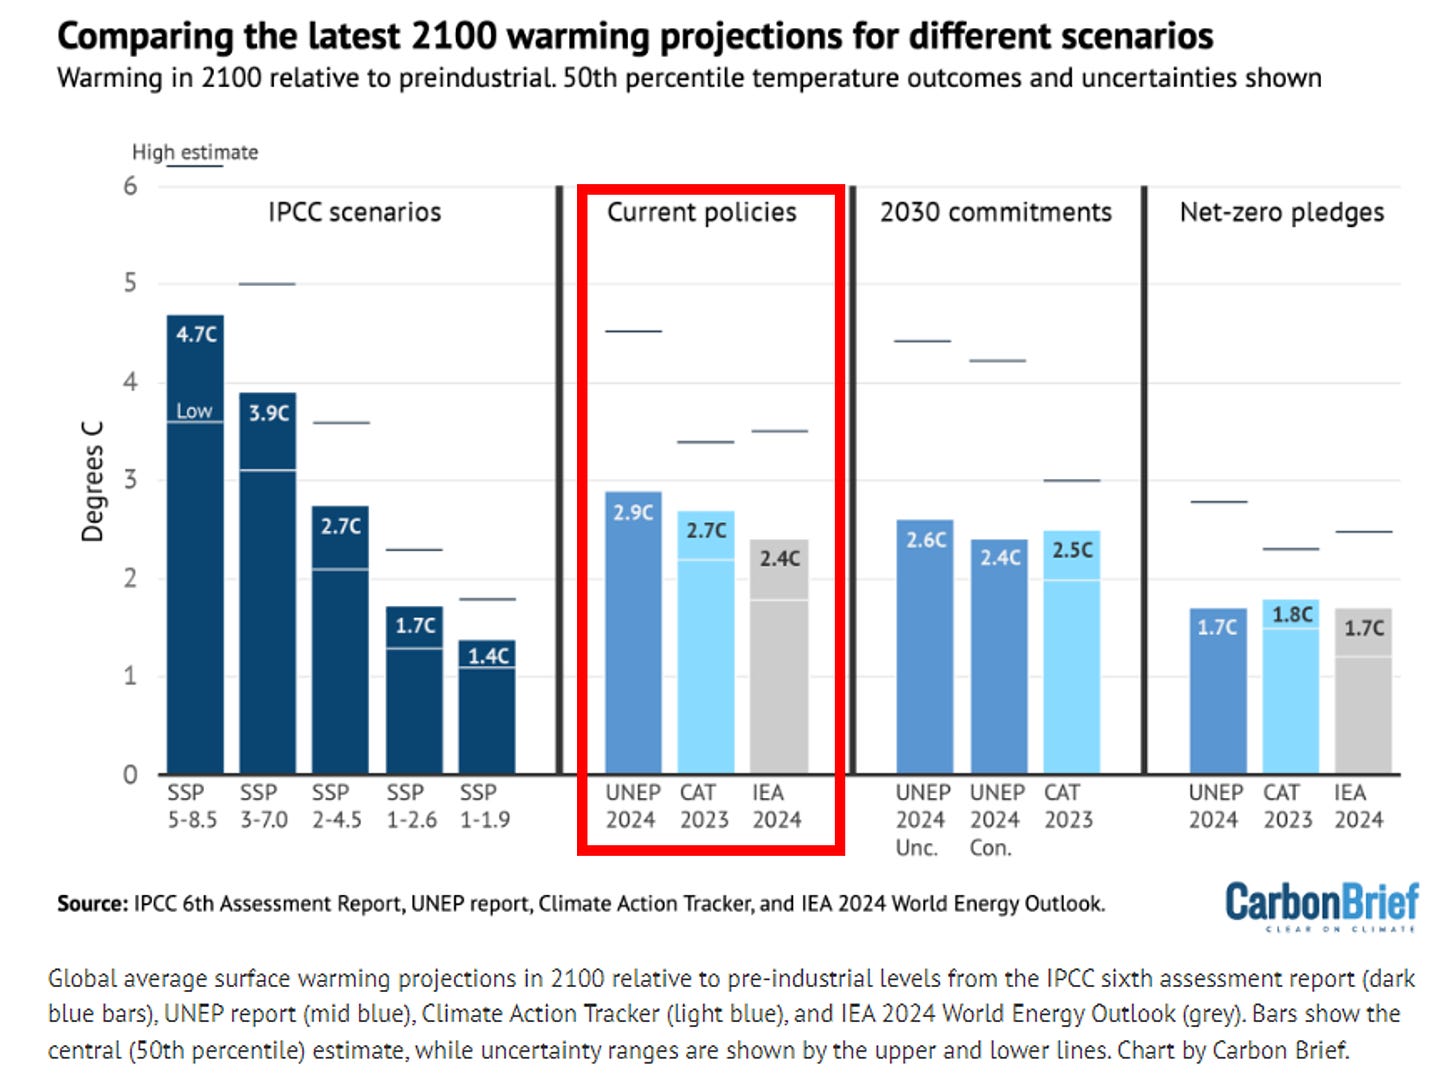
You can see in the figure three different “current policy” projections for 2100 global temperatures above preindustrial levels:
As the figure shows, the center of these three projections — 2.7C — is the same as that which results from the SSP2-4.5 IPCC scenario (shown in the figure’s leftmost panel).
In his FT column, Burn-Murdoch cites my AEI colleague and demographic expert Jesús Fernández-Villaverde, of the University of Pennsylvania, suggesting an alternative projection for future population growth, one more consistent with recent observations:1
According to Fernández-Villaverde’s calculations, the combined impact of the yawning misses for emerging market countries and smaller overestimates for wealthy western nations puts the true global population trajectory on the UN’s “low fertility” pathway. That would mean a peak at around 9bn in 2054, 30 years earlier than in the headline forecast.
A peak population of 9 billion in 2054 is about 20 years earlier and 500 million people less than the population peak projected under the SSP2 scenario. As I’ve often discussed, the Kaya Identity tells us that, all else equal, fewer people means less carbon dioxide emissions.
Thus, if we use Fernández-Villaverde’s population peak projection instead of the population projection of SSP2, then cumulative carbon dioxide emissions over the 21st century would be less than under SSP2-4.5 and global temperatures would be lower as well.
We can get a sense of the sensitivity of SSP2-4.5 temperature projections to population assumptions by recognizing that Fernández-Villaverde’s population peak projection is similar to that of another IPCC scenario, SSP1. If we simply assume that cumulative emissions over the 21st century are proportional to population, then replacing SSP2 population with SSP1 population under the SSP2 scenario results in 11.6% less carbon dioxide emissions over the century.2
To estimate the consequences for projected 2100 temperature, I took a simple linear relationship between cumulative carbon dioxide emissions of the 21st century and 2100 global temperatures, using the seven primary IPCC climate scenarios, as shown in the figure below.
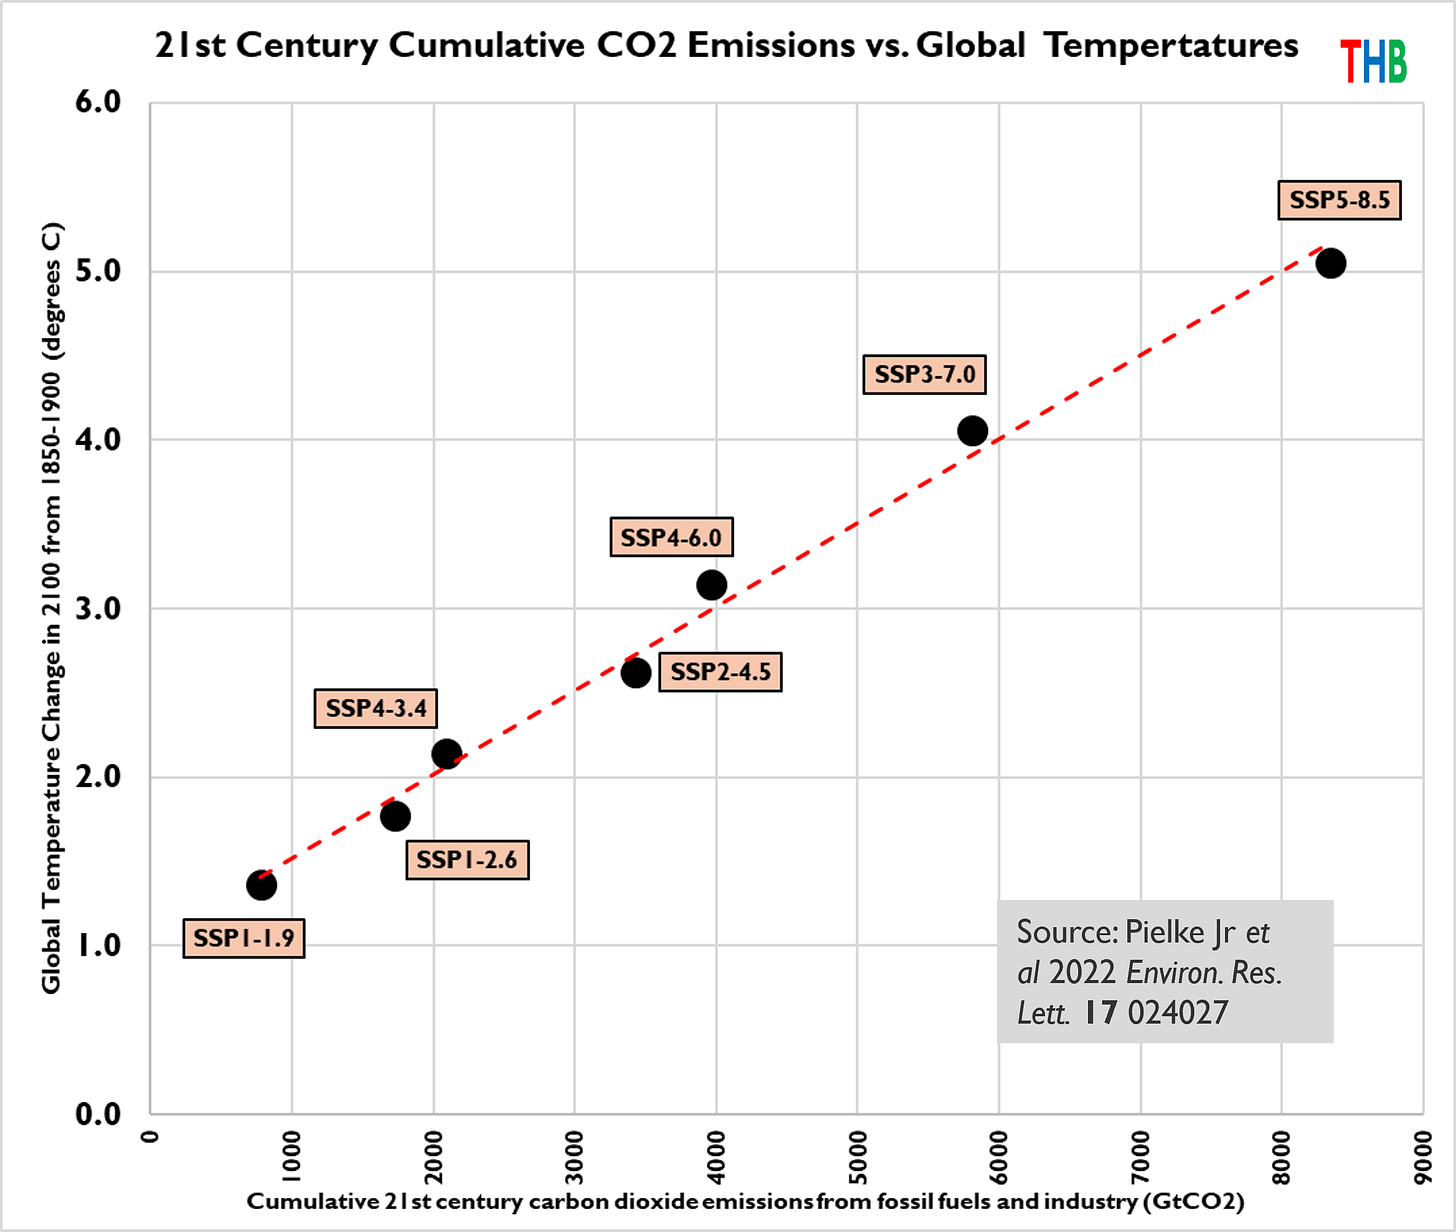
We can use that linear relationship to estimate what happens to projected 2100 global temperature when we use cumulative emissions under SSP1 population assumptions for SSP2-4.5 projections — all else equal.
Before I show the results, I decided to use this exercise to also explore the consequences of alternative assumptions for future GDP growth on projected 2100 global temperatures under “current policies.”
To do that, I use a new set of GDP projections from my frequent collaborator and economist extraordinaire Matthew Burgess, of the University of Wyoming, and colleagues, who make a case for future growth rates to be lower than those of SSP23:
[S]low-growth, slow-convergence economic scenarios deserve greater attention in research and policy, and that the range of economic scenarios treated as plausible in research may need to be revised in this direction. SSP4 is currently seen as a worst-case scenario for global income convergence and a relatively slow-growth scenario. In contrast, SSP4 is modal compared to our projections, which would have over-projected economic growth and income convergence historically. This suggests that SSP4 might actually be a more realistic best-case scenario for growth and convergence.
In this exercise I use two projections from Burgess et al. 2023 that together bracket SSP4 GDP projections to 2100, and I encourage you to consult their paper for details:
A more pessimistic (lower growth) differential equation model (which they call DEM) — slightly lower growth than SSP4;
And a less pessimistic (not as low growth) asymptotic differential equation model (which they call ADEM) — slightly greater growth than SSP4.
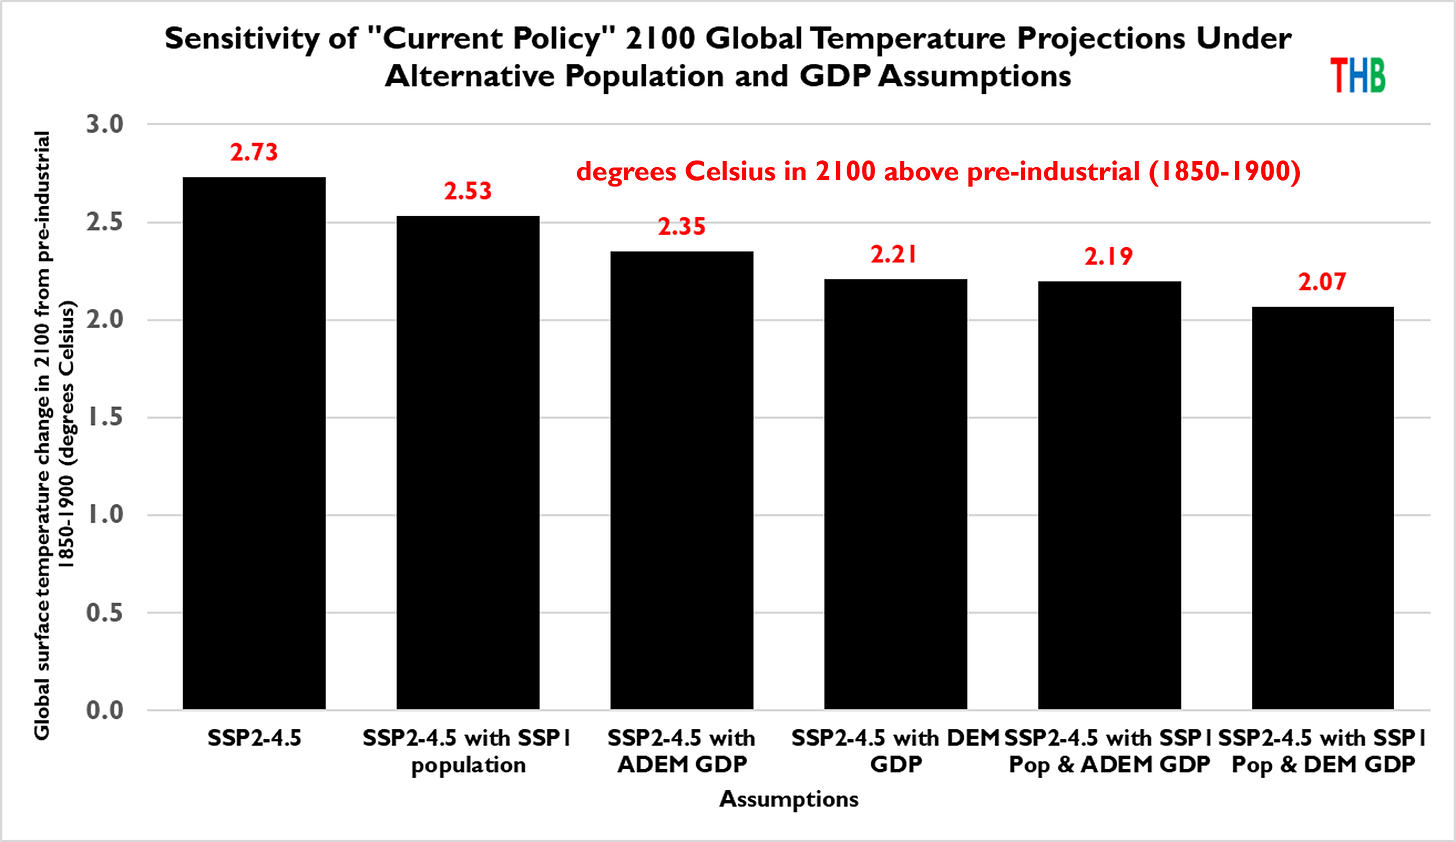
With all of the pieces in place, the figure below shows how projected 2100 global temperatures change under different combinations of assumptions for population and GDP, as compared to SSP2-4.5.
You can see in the figure above that introducing assumptions of future global population and GDP growth rates slower than those of SSP2 result in less projected warming to 2100 — and under some assumptions, much less, more than 0.6C.
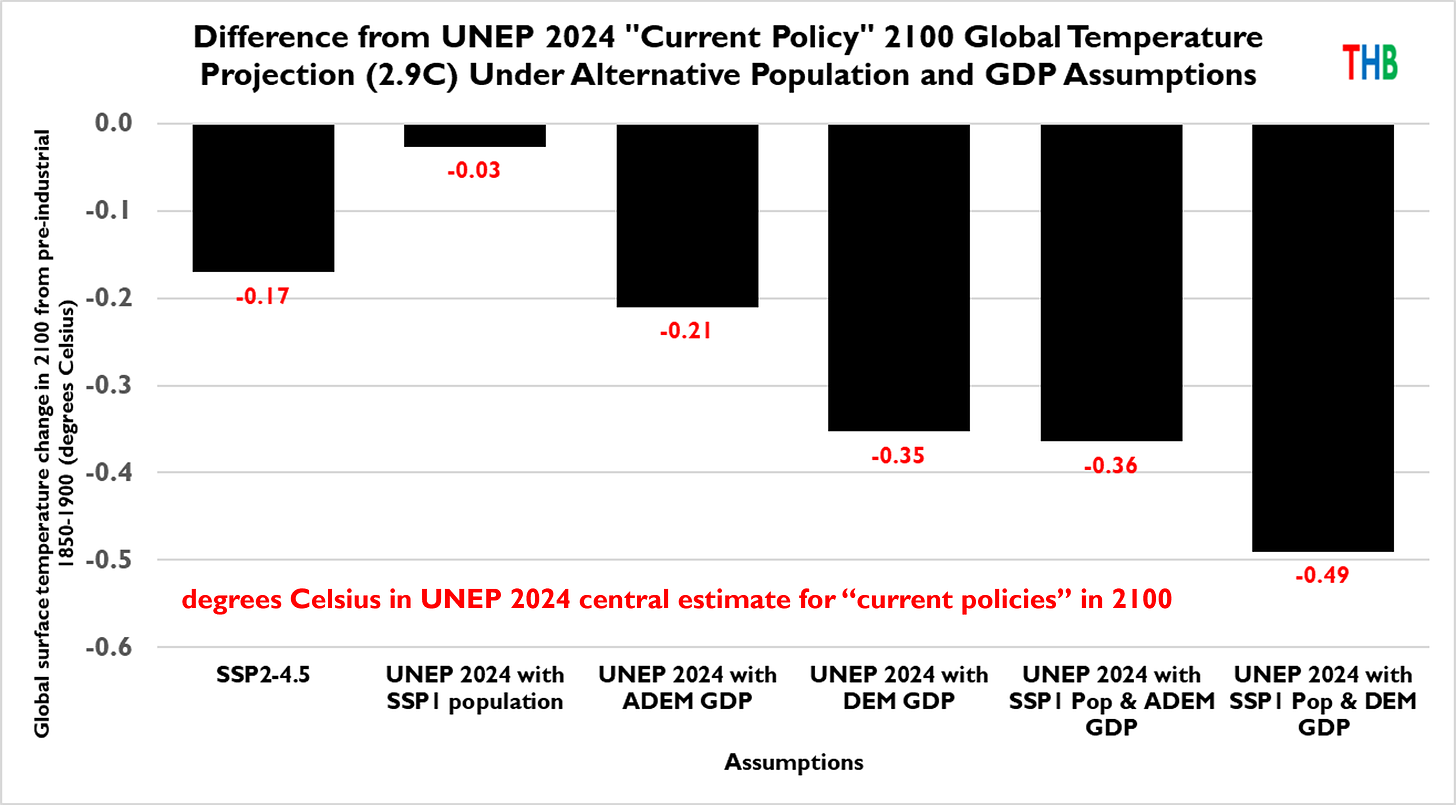
Next, let’s have a look at the implications of the alternative assumptions for the “current policy” projection of the UNEP Emissions Gap Report from last week. In the figure below I simply show the difference between SSP2-4.5 and each set of assumptions as applied to the 2.9C central projection from UNEP. For instance, the leftmost bar shows that SSP2-4.5 is 0.17C less than than the UNEP central estimate.
You can see that the largest difference is about half a degree Celsius, which would take the UNEP central estimate to 2.4C. If we were instead to apply this analysis to the IEA “current policy” projection of 2.4C in 2100, the largest decrease would bring estimates very close to 2.0C for 2100, which is the Paris Agreement target.
What to take from this exercise?
The scenarios that today guide climate research and policy continue to become increasingly out-of-date. Consider that SSP3 — which has global population implausibly approaching 13 billion and rising in 2100 — has been the subject of almost 1,500 papers so far this year.
Updated understandings of population and GDP suggest that, at a minimum, the “assumption space” used to generate scenarios needs to reorient away from extreme socio-economic assumptions (like those underlying RCP8.5) and towards more realistic socio-economic scenarios consistent with observations of the real world.
Every time global population GDP projections are revised down, the challenge of climate change appears that much more tractable. Of course, peak population and slower economic growth bring with them considerable societal and policy challenges of their own.
“Current policy” projections are based on very conservative set of assumptions — who thinks there will be no new climate and energy policies? — and many countries have committed to accelerating decarbonization. Conditional on slower-than-projected population and/or GDP growth, that means that even partial future policy successes could more easily bring into view future emissions consistent with a 2C temperature target. Basing our expectations on the latest understandings of population and GDP changes is thus essential for a clear-eyed view of climate and energy challenges.
Just as recent rates of change in fertility around the world have surprised demographers, there will no doubt be future surprises in store for us across many different assumptions. Such surprises will inevitably cut both ways — some making problems more difficult, other making them more tractable — highlighting the need for policies that are robust to uncertainties and ignorance.
There are many different ways that the simple sensitivity analyses I performed above might be undertaken, and this exercise is meant to be suggestive and not definitive.4 What is certain, however, is that the climate policy community needs to figure out how to obtain scenario-based projections that are based on underlying assumptions grounded in the most current understandings — rather than those from years and decades past.
Specifically, if the research community cannot figure out how to develop scenarios for climate projections on an annual basis — as energy system modelers do routinely — then those who rely on climate projections should create new institutions to fill that gap. Climate policy is far too important to be grounded in understandings long past their sell-by date.
The analyses you read, share, and discuss here at THB are made possible by paying subscribers who have the means and motivation to support this new approach to research and writing. Please consider joining them, as honest brokering is a group activity!
I’ve discussed Fernández-Villaverde’s work here at THB before.
Specifically, I summed person-years from 2030 to 2100 under SSP1 and SSP2 and took the ratio.
I am probably by inclination more optimistic than Burgess et al. 2024 on future growth, but they make a very compelling, quantitative case. Thanks to Matt for quickly sharing his data and making this analysis possible!
I encourage others to perform similar analyses.


Roger, I was startled to read this: "Consider that SSP3 — which has global population implausibly approaching 13 billion and rising in 2100 — has been the subject of almost 1,500 papers so far this year." I would guess this is because the basic ideas for these models were developed in the early 1990s, and thus include assumptions that might have made sense back then, but don't now. And they've been kept because people want to keep the models consistent over time. Is that correct? Also, are the other SSPs as out to lunch on their population assumptions?
Thanks for this. Exactly why I subscribe.