“We conclude that the historical Atlantic hurricane data at this stage do not provide compelling evidence for a substantial greenhouse warming-induced century-scale increase in: frequency of tropical storms, hurricanes, or major hurricanes, or in the proportion of hurricanes that become major hurricanes” NOAA
Tropical storm Idalia is projected to make landfall in Florida in a few days. That means hurricane hype will no doubt be dialed up to 11. For those who’d like to be able to place that hype into the context of evidence and research, this post offer some quick points and pointers.
I encourage everyone, especially journalists, to start with NOAA’s Global Warming and Hurricanes overview. It is updated (May 2023) and led by Tom Knutson, whose work along with colleagues provided much of the basis for the conclusions of the recent IPCC AR6 WG1 on tropical cyclones and hurricanes.
Here is what NOAA concludes:
“We conclude that the historical Atlantic hurricane data at this stage do not provide compelling evidence for a substantial greenhouse warming-induced century-scale increase in: frequency of tropical storms, hurricanes, or major hurricanes, or in the proportion of hurricanes that become major hurricanes.”
Let me know if you see that statement quoted in any reporting this week.
What about IPCC?
“[T]here is still no consensus on the relative magnitude of human and natural influences on past changes in Atlantic hurricane activity, and particularly on which factor has dominated the observed increase (Ting et al., 2015) and it remains uncertain whether past changes in Atlantic TC activity are outside the range of natural variability.”
You will likely hear a common refrain — something like There are not more hurricanes, but the ones that do form are likely to be major hurricanes due to climate change. Here is a cherry-picker’s guide to supporting or countering this slogan:
The panels below show the proportion of major hurricanes to 2022 starting in 2002 (left), 1980 (middle) and 1950 (right).
You can see that by varying the starting date you can get a downward, upward or no trend. This helps to explain why NOAA reached its conclusion that I quoted above. Data, methods and discussion here.
You will also likely hear claims that hurricanes now result in greater precipitation. Here is what NOAA says about that:
“an anthropogenic influence has not been formally detected specifically for hurricane-related precipitation”
Again, tell me if you see that quoted anywhere.
How much normalized hurricane damage has occurred in El Niño years? The figure below answers that question and is discussed here. Source our peer-reviewed research for a more in-depth discussion of ENSO and landfalling hurricanes.
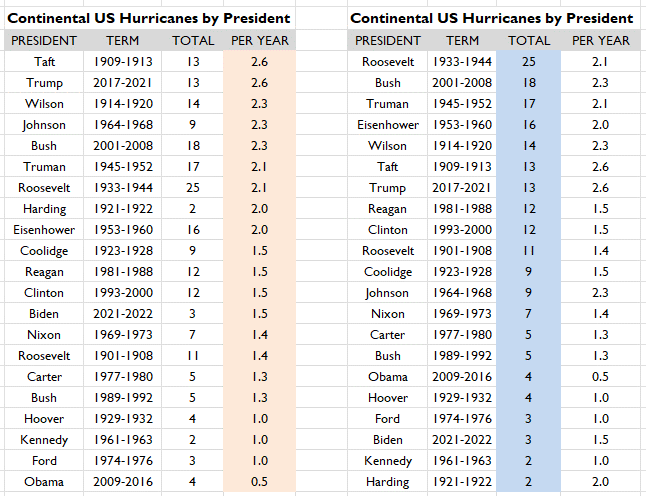
What U.S. president saw the most continental U.S. hurricane landfalls?
President’s Taft and Trump more than a century apart had the highest rate — 13 landfalls over their four years in office. President Obama had the lowest — 4 in 8 years. Thanks Obama!
Finally, via Ryan Maue, the figure below shows 12-month running sums of hurricanes and major hurricanes around the world. Through July, 2022 was at near-low counts of major hurricanes since 1980.
I welcome comments, questions and suggestions. Thanks for reading. As usual, I’d appreciate shares and likes. The best way to counter false information is with better information, so spread the word! Have a great week.


Can’t wait to share this data at the next cocktail party. Facts don’t lie.
Thank you
Re your Atlantic hurricane plot. You use median numbers as measures of central tendency. If I
extract your data, which I can only do "by eye", I find: La Nina, n=20, mean = 21.8; Neutral, n=24, mean = 16.8; El Nino, n=17, mean = 11.9. (You could check using the actual numbers.)
Same order ... La Nina>Neutral>El Nino. But, large variability, so I suspect no significant differences. (From Tom Wigley.)