


Trends in the Proportion of Major Hurricanes
The data behind a major blunder by the IPCC


A top conclusion of the recent Synthesis Report of the Intergovernmental Panel on Climate Change (IPCC) is that the attribution of observed changes in tropical cyclones to human influence has strengthened over the past 9 years. The IPCC does not actually justify its claim that both detection of changes and their attribution have been achieved. So in Part 1 of this exploration I tracked back the claim, and found that it had no support in the one paper miscited by the IPCC in support of the claim.
In this second part, I look at official data on tropical cyclones, and find that the evidence also does not support the IPCC claim of detection and attribution related to tropical cyclones.
Thus, a false claim about tropical cyclones made its way into the IPCC Synthesis Report and its Summary for Policy Makers. In an ideal world a blunder of this magnitude would prompt some thinking about how the IPCC performs its scientific assessments, whether it may have drifted from that mission and if it can do better.
The IPCC AR6 failed spectacularly on tropical cyclones in concluding that both detection and attribution have not only been achieved related to an increasing proportion of major hurricanes, but that such conclusions have strengthened since 2014. This is all fiction, misinformation even. Yes, I know these are strong words. The IPCC is far too important to allow errors of this magnitude.

Before proceeding, a quick note on the terminology I’m using in this post, as there is often some confusion in the specialized jargon of tropical meteorology:
Tropical cyclone: the general category of storm, defined in the image above
Hurricane, cyclone, typhoon are each names for strong tropical cyclones, depending on where they occur around the world (and names for weaker cyclones include tropical depressions and tropical storms)
A tropical cyclone of “hurricane strength” has maximum sustained winds of >119 kph (74 mph)
A tropical cyclone of “major hurricane strength” has maximum sustained winds of >178 kph (111 mph)
On to the evidence . . .
We are in luck. Data on tropical cyclones are among the most studied and reliable data you can find in climate science. These data are the result of thousands, maybe tens of thousands, of people doing the heroic work of science over more than a century. The resulting dataset is called the International Best Track Archive for Climate Stewardship (IBTrACS) — a monumental scientific achievement (and also one the IPCC tried to throw shade on for not providing the “right” trends, but I digress).
Thanks to IBTrACS, data on tropical cyclone incidence worldwide is readily at our fingertips. For instance, at Colorado State University, Phil Klotzbach uses IBTrACS to keep a real-time dataset of global tropical cyclone activity that is easy for anyone to use — and I use it often. The IBTrACS data is the basis for the analyses below.

The figure above, via Ryan Maue’s excellent site, shows 12 month running sums of (top line) tropical cyclones of hurricane strength and (bottom line) tropical cyclones of major hurricane strength. You don’t need a math degree to see that there is no upwards trend in either. What we are looking at today, however, is the ratio of the bottom line to the top line — the proportion of all tropical cyclones of hurricane strength that are major hurricanes.
Below is a figure showing the proportion of hurricanes since 1980 that are major hurricanes.
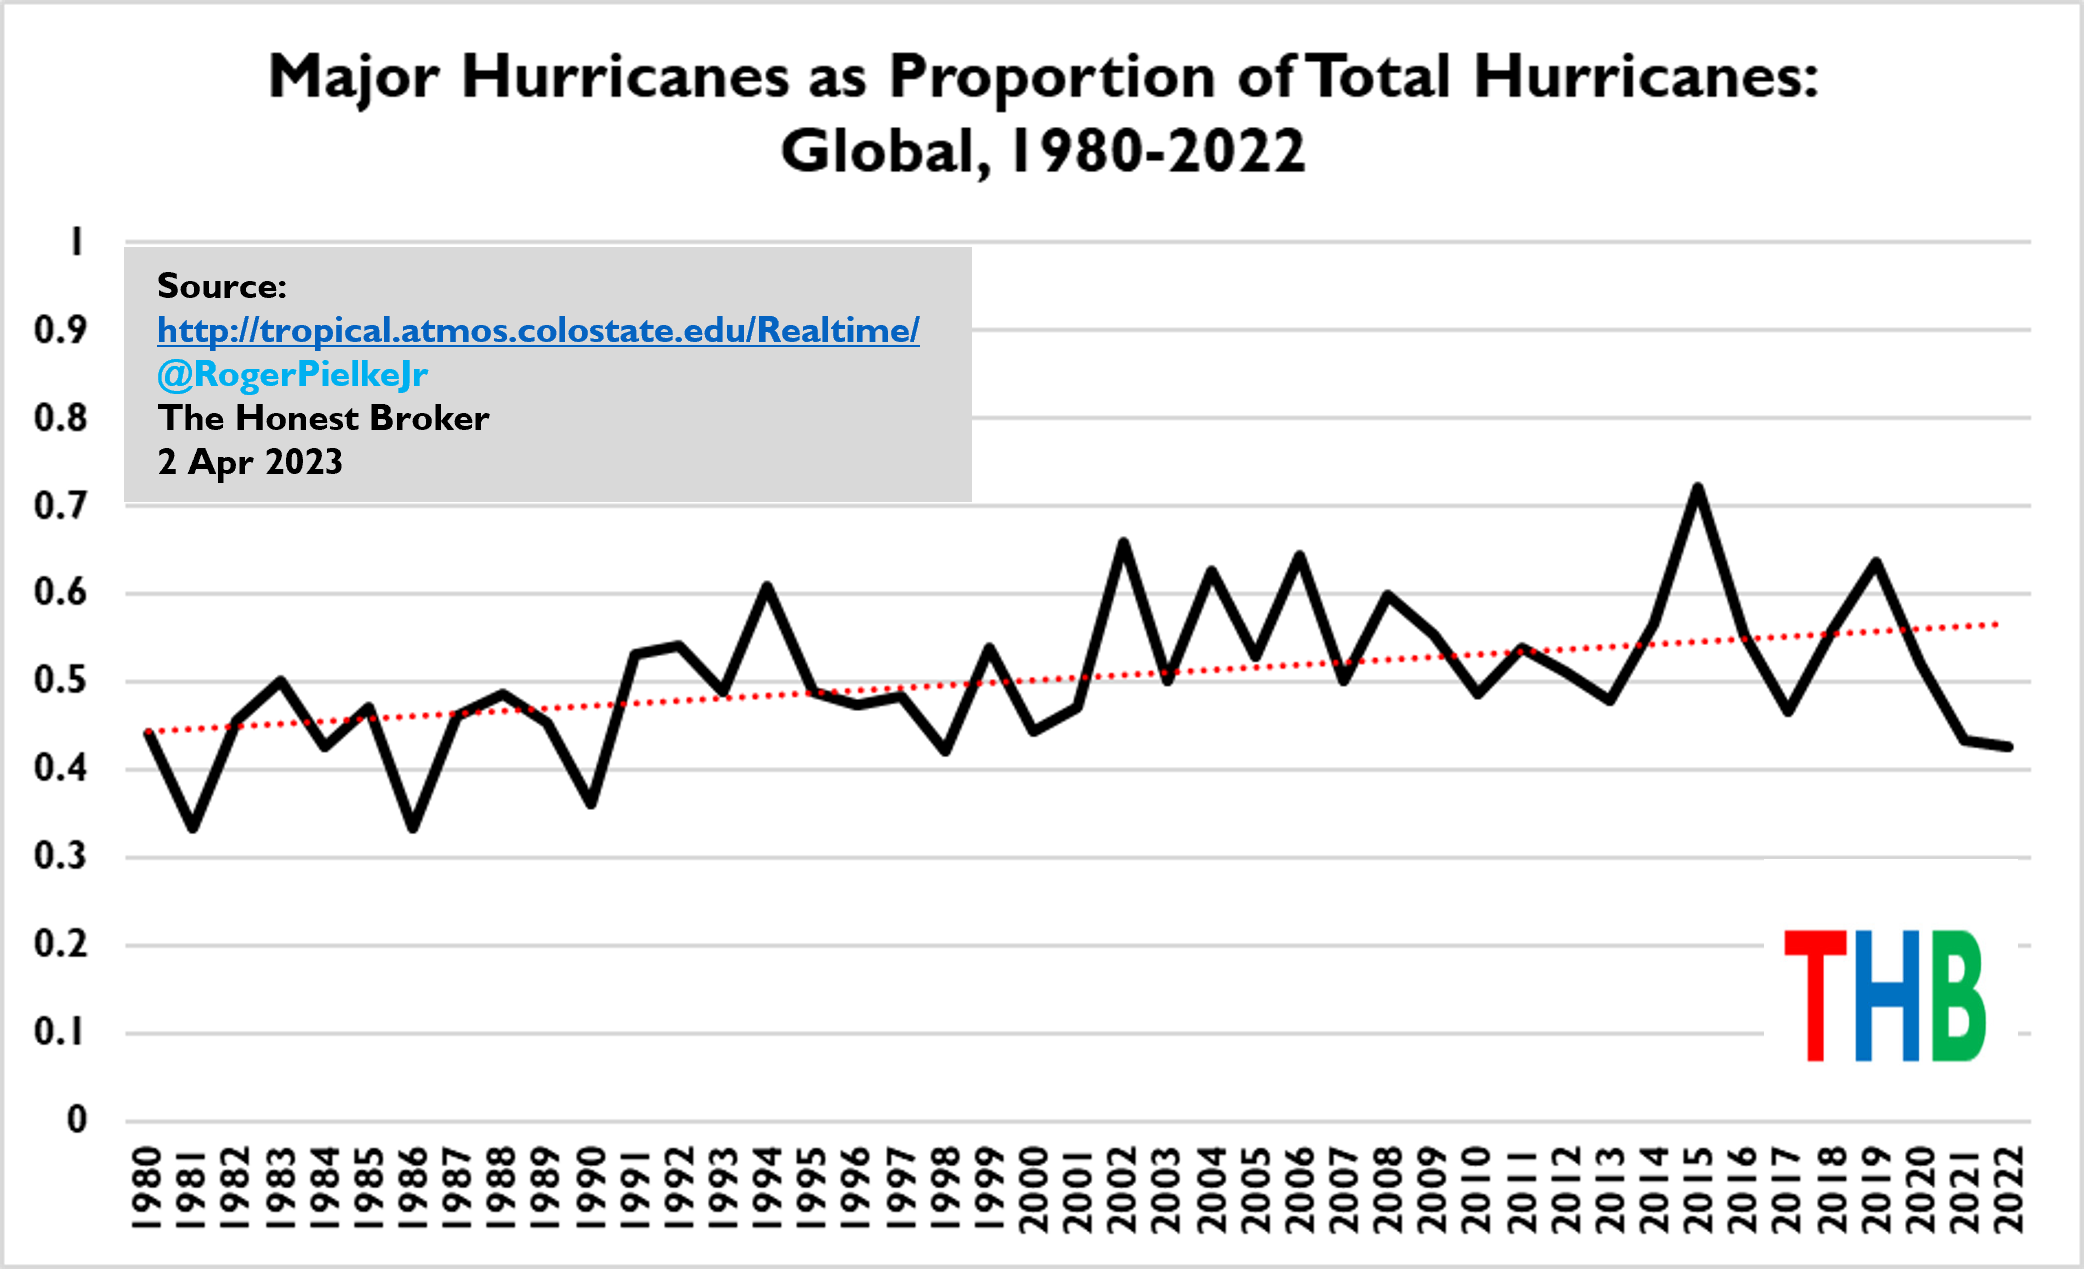
We there we have it, there has been an increase in the proportion of major hurricanes since 1980. That must be climate change, right? Case closed?
Not at all.
You’ll note that the time series above starts in 1980. That is when the IBTrACS dataset has global coverage. It is also right in the middle of a decade-plus period where hurricane activity was extremely low, perhaps even the lowest in centuries. Starting any trend analysis in 1980 for tropical cyclones is thus very likely to result in up trends, but that doesn’t mean that they are the result of human-caused climate change (hence my tongue-in-cheek paper title in the cartoon at the top!).
Here it is important to revisit how the IPCC defines the detection of a change in climate:
Detection of change is defined as the process of demonstrating that climate or a system affected by climate has changed in some defined statistical sense, without providing a reason for that change. An identified change is detected in observations if its likelihood of occurrence by chance due to internal variability alone is determined to be small, for example, <10%.
To conclude that a variable has changed requires demonstrating that a trend in observed statistics goes beyond that which might be observed within the variability of those data. Otherwise we risk misidentifying noise or internal variability as a change in the system. Climate data can be highly variable over many different time scales — this of course is why cherry picking of data can be problematic, but also appealing to the mischievous.
Fortunately, on tropical cyclones, there are much data that predates 1980 allowing us to explore in more depth internal variability in tropical cyclone occurrence and how apparent trends compare to that variability.
Specifically, there are longer-term data on tropical cyclones in the North Atlantic and Western North Pacific — NA and WNP, which together represent about 50% of all global activity — which dates to 1950. Let’s take a look at what those data show.
The figure below shows in red the global data (same as in the graph above). The figure shows in black the proportion of major hurricanes for the NA and WNP. As we would expect, these time series are highly correlated, since the latter comprises 50% of the former.

We can conclude with some confidence that trends in the proportion of major hurricanes in the NA & WNP combined make for a good proxy for trends in the proportion of major hurricanes at the overall global level. So let’s next look at trends in the NA and WNP from 1950, shown below.
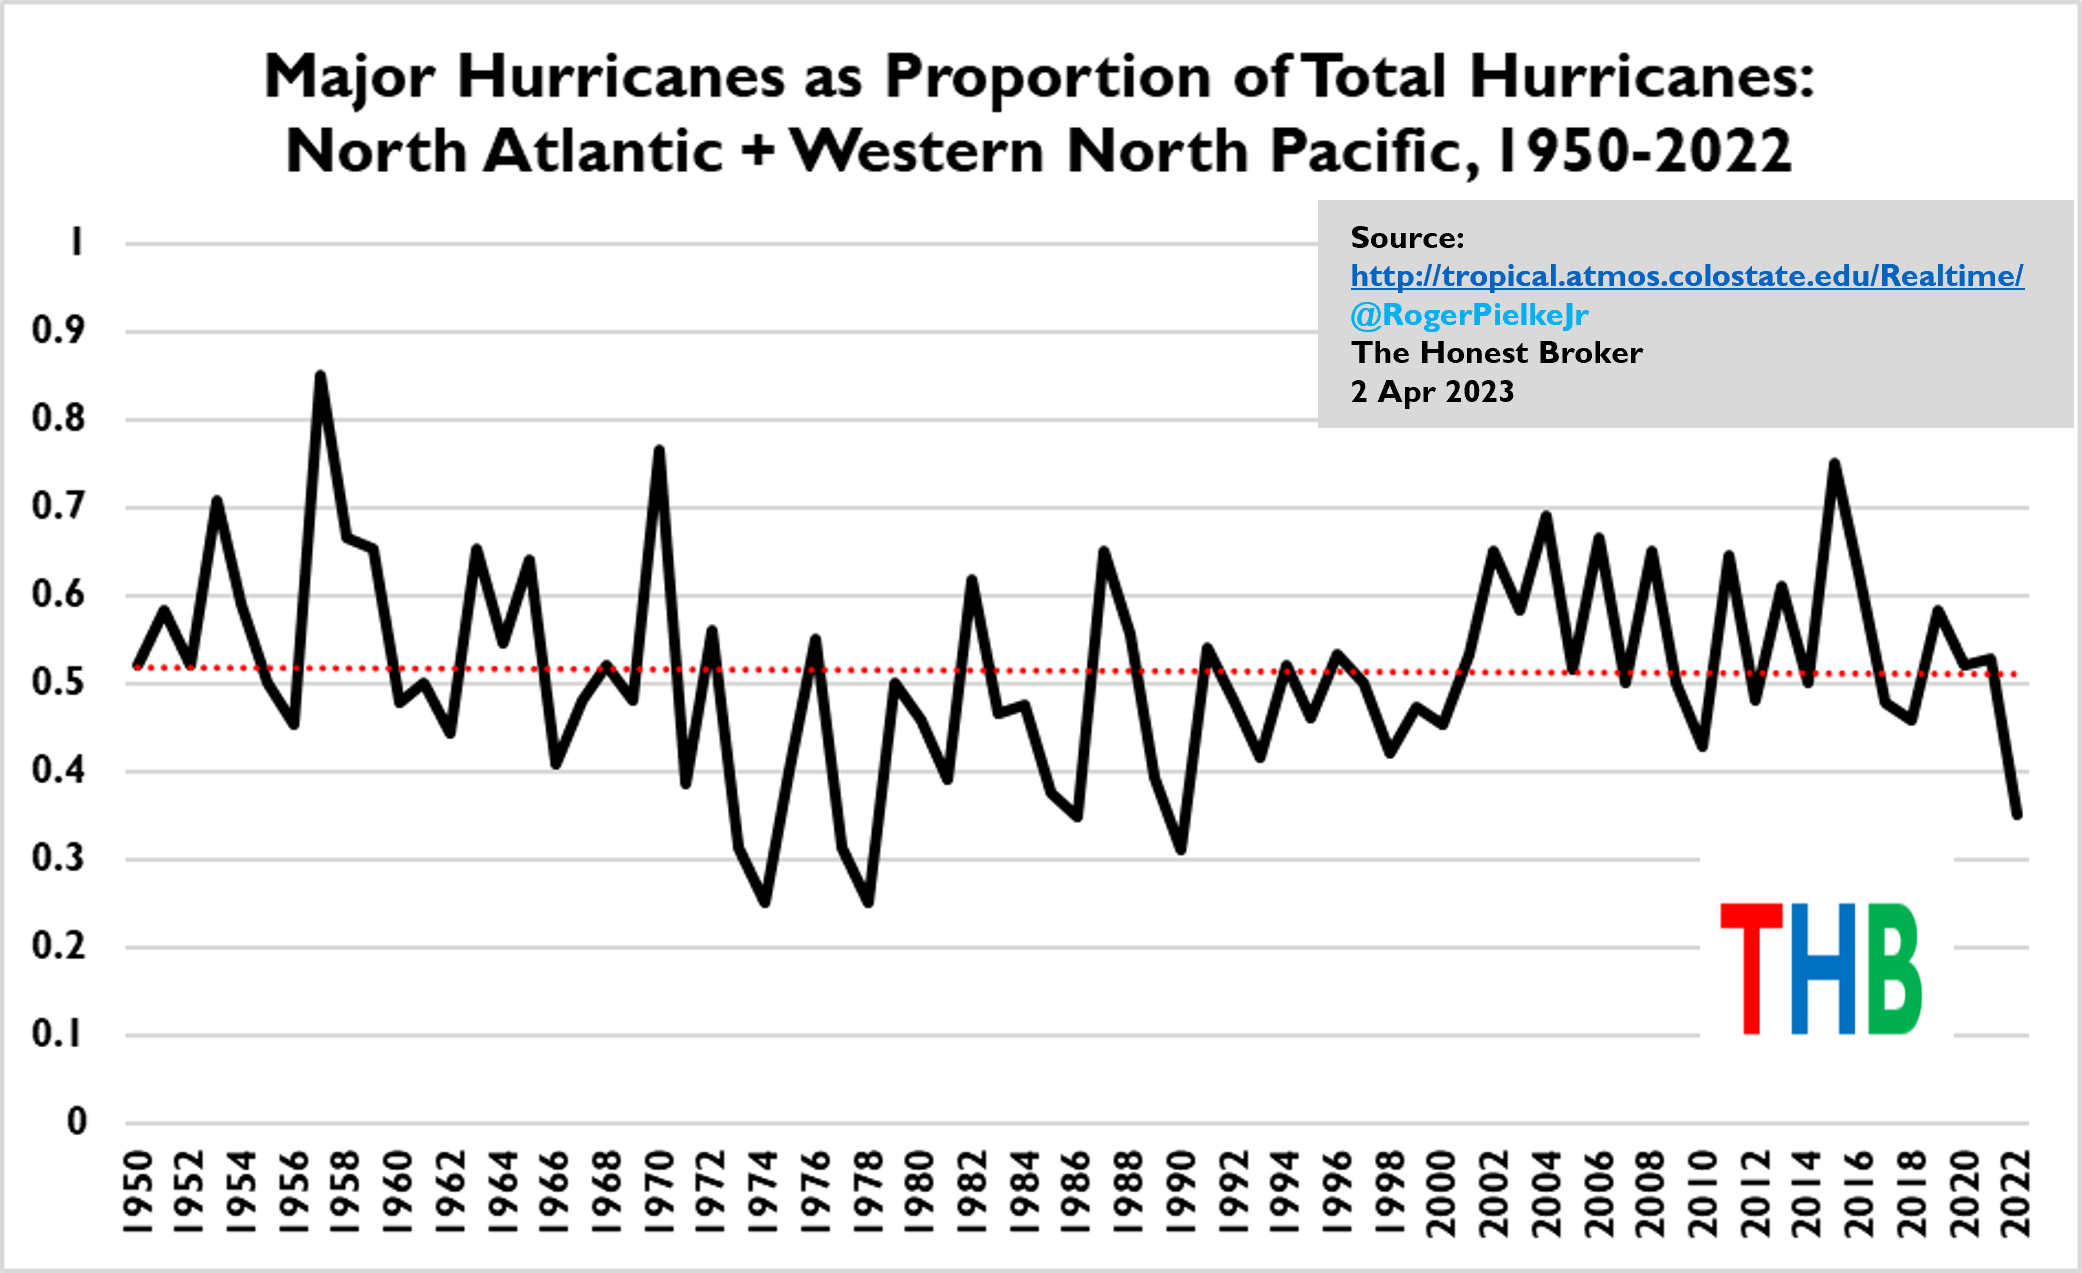
From 1950 to 2022 there is no trend in the proportion of major hurricanes. But if you start an analysis in the 1970s or 1980s, you will get an up trend.
One more figure to complete the analysis. The figure below shows the global proportion of major hurricanes from 2002 to 2022, showing a decrease.
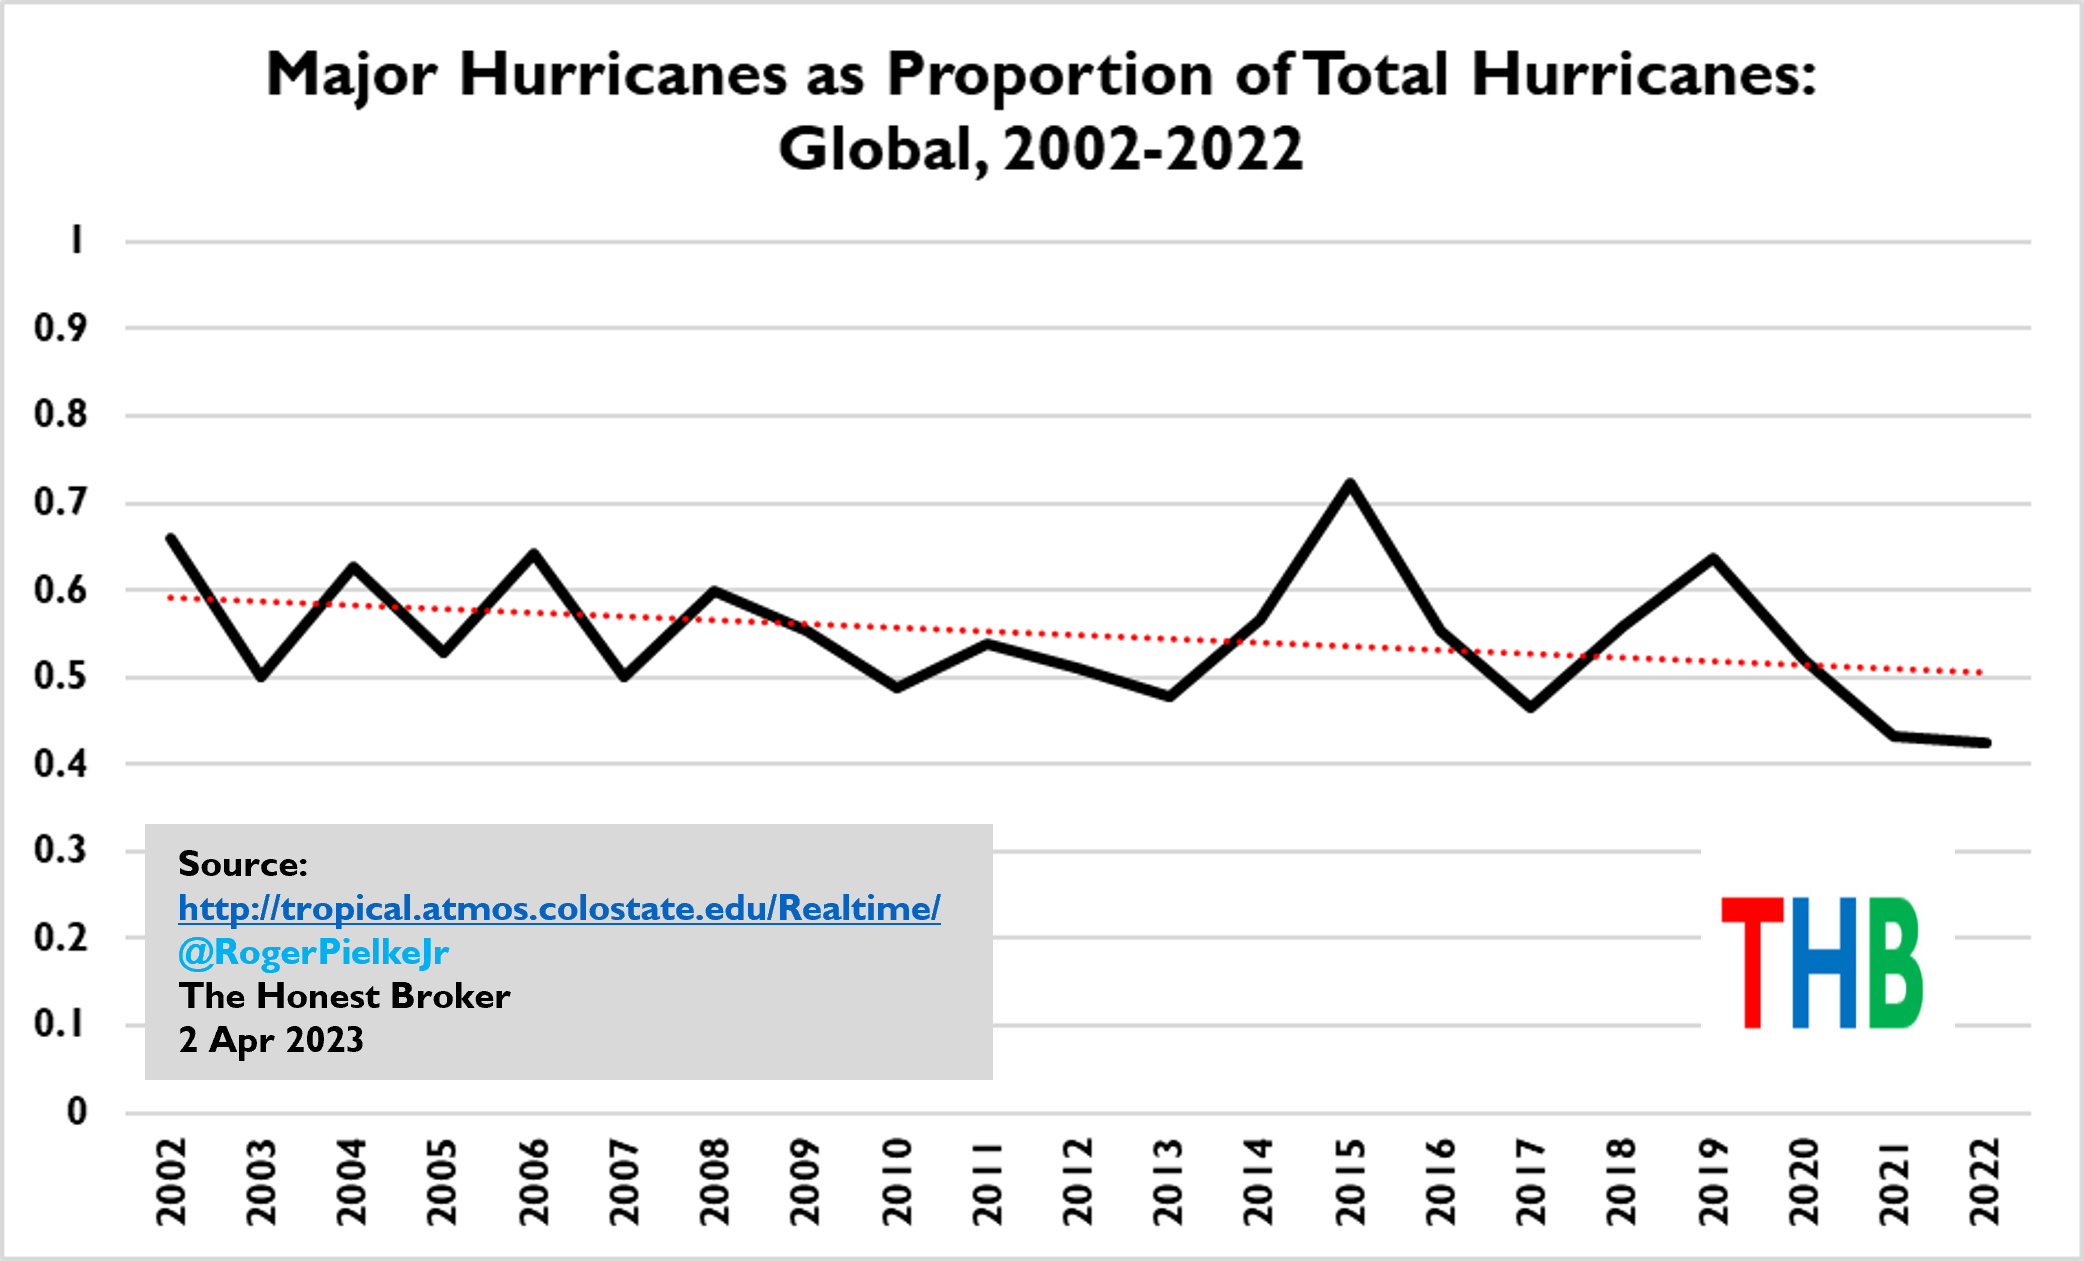
So where does all this leave us? Well, here is a cherry picker’s guide to proportion of major hurricanes:
Want to show an increase? Start your analysis in 1980
Want to show no trends? Start your analysis in 1950
Want to show a decrease? Start your analysis in 2002
More seriously, what does the scientific community conclude when a climate time series does not indicate trends outside the bounds of observed variability?
Detection has not been achieved.
That means there is no trend to attribute. Neither detection nor attribution have been achieved.
The IPCC AR6 failed spectacularly on tropical cyclones in concluding that both detection and attribution have not only been achieved related to an increasing proportion of major hurricanes, but that such conclusions have strengthened since 2014.
This is all fiction, misinformation even. Yes, I know these are strong words. The IPCC is far too important to allow errors of this magnitude.
Note: I am happy to hear counter arguments and critique. So far, on my earlier post there has been none. THB welcomes a diversity of views. Science is made stronger through transparency, openness, disagreement and debate — which we all should welcome. Climate change is far too important to accept anything less.
I appreciate your support. I am embarking on an experiment to see if a new type of scholarship is possible. I am looking to make a break from traditional academia and its many pathologies, and this Substack is how I’m trying to make that break. I am well on my way. Please consider a subscription at any level, and sharing is most appreciated. Independent expert voices are going to be a key part of our media ecosystem going forward and I am thrilled to be playing a part. You make that possible.
Again, great to see the data. Love the fact based analysis you bring to a very important topic. Possibly one typo...you say data from 1950-1922. Believe you mean 2022.
Great article. One story that might change the 1950-2022 trend though. In 2005 in the Gulf of Mexico (GOM) we had Hurricane Katrina and Rita roughly a month apart. Two 500 to 1000 year hurricanes a month apart! Significant damage was done to many offshore platforms. Simplifying, offshore platforms are constructed with air gaps (water level to lowest deck) to withstand the 100 year storm with no damage and only minor damage in 1000 year storms (the platform should still be there in the morning). Given the 2005 storm season and damage done to many platforms we started wondering if we had the design basis incorrect. Of course the first hypothesis was storms were getting more severe. So the met-ocean folks dug into the data and sure enough we did have the severity data wrong, but NOT for the reason we thought. The problem was the data before 1960 or so. What happened in 1960? We started flying airplanes into storms. Before that the data was measured at the beach and extrapolated offshore. So, as an example, more Cat 5 storms offshore landed as Cat 2 than we thought.
Not sure how the severity data Roger shows was observed, but if storm severity was measured at the beach, then the older data is biased to weaker storms, and lower severe to total ratios, further making the case in this paper.