


Welcome to the Era of Energy Realism
Five key figures from JP Morgan's 2025 Energy Report

Every year for the past 15 years, JP Morgan publishes an outstanding annual energy report by Michael Cembalest. Last week JP Morgan published its 2025 edition and today I share five important figures from the many in the report, which I highly recommend.
Cembalest’s top line:
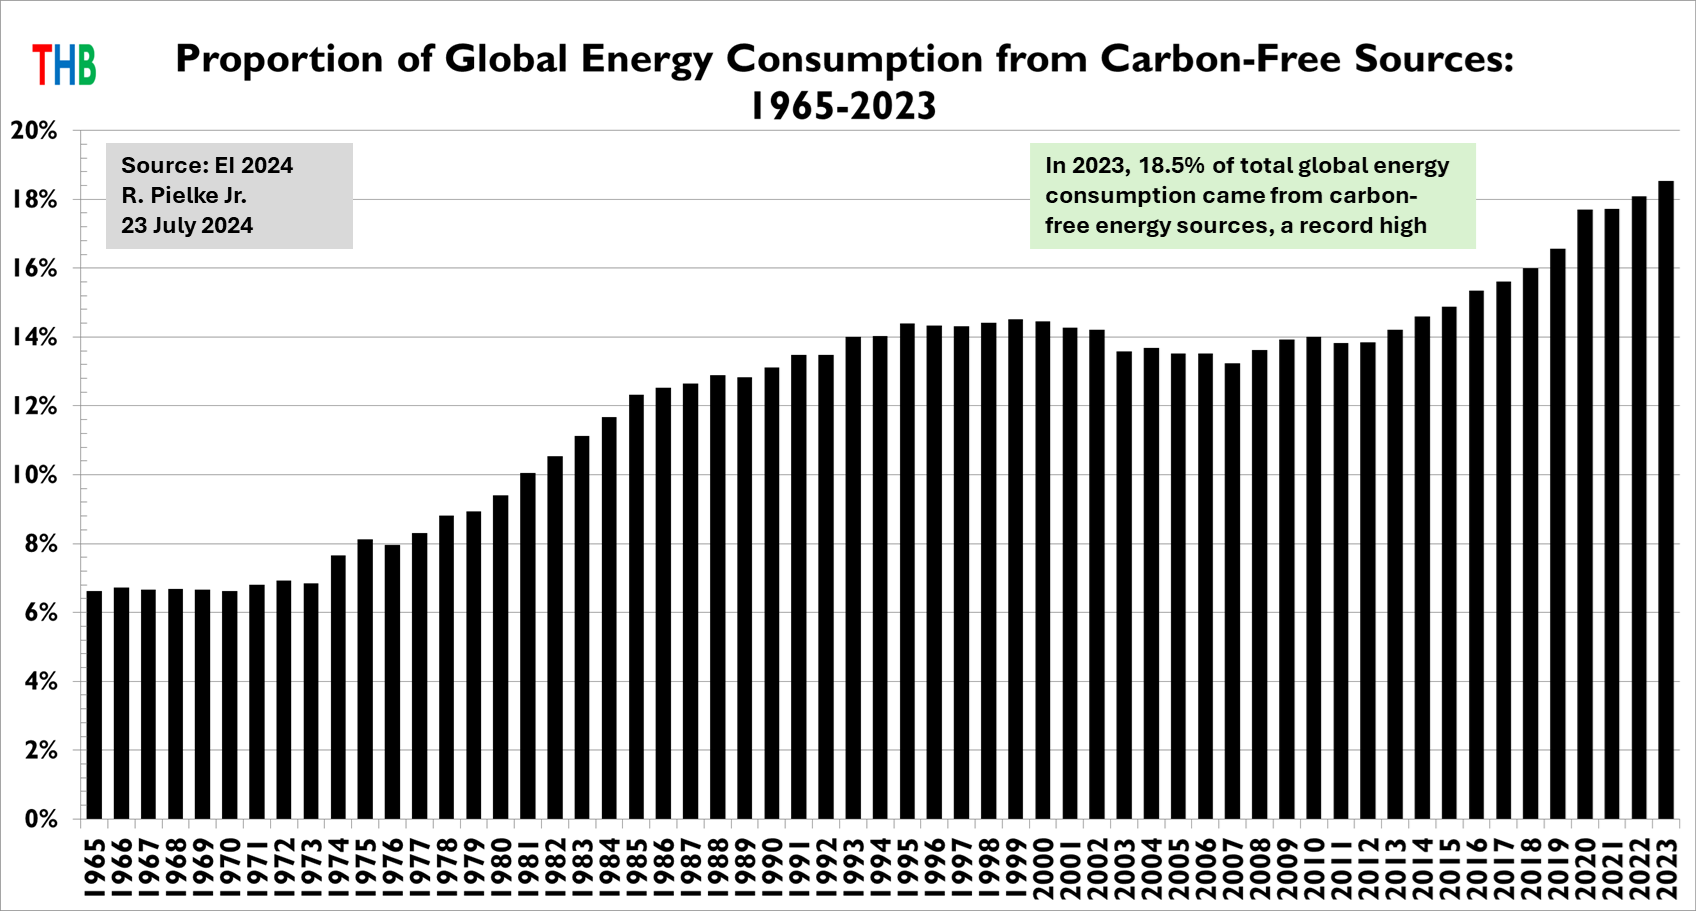
[A]fter $9 trillion globally over the last decade spent on wind, solar, electric vehicles, energy storage, electrified heat and power grids, the renewable transition is still a linear one; the renewable share of final energy consumption is slowly advancing at 0.3%–0.6% per year.
You can see that in the figure below — my graph using data from the 2024 EI Statistical Review of World Energy — which shows the proportion of global energy consumption from all carbon-free sources. Since 2012, that proportion has increased from about 14% to a bit over 18%. Exactly as Cembaest observes — that increase has been linear. At that rate of change the world would hit 100% carbon-free sometime after 2200.
Let’s take a look at some of the figures I found most interesting in the JP Morgan Report.
Solar Reality Check
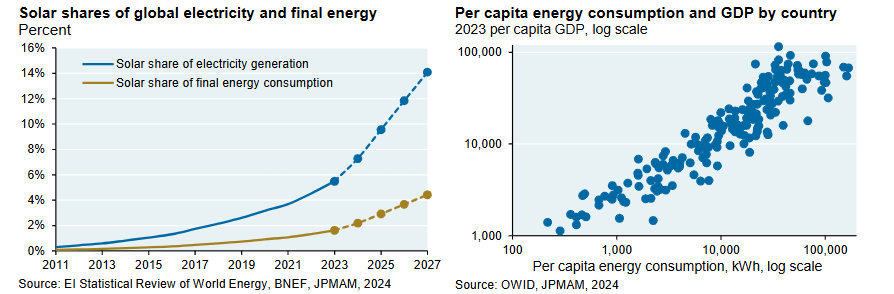
“. . . when you boil it all down, solar power accounts for ~2% of global final energy consumption, a figure we expect to reach 4.5% by 2027. Even if these solar trends continue into the 2030’s, human prosperity will be inextricably linked to affordable natural gas and other fossil fuels for many years. Human prosperity, in places where it thrives, relies heavily on steel, cement, ammonia/fertilizer, plastics, glass, chemicals and other industrial products which are energy- intensive to produce. . . these products currently rely on fossil fuels for 80%-85% of their energy. And remember, prosperity itself is energy-intensive: among the tightest relationships in economics is the connection between a country’s per capita GDP and its per capita energy consumption.”
I remain very bullish on solar, but it won’t displace much fossil fuels anytime soon.
Electrify Everything is Proceeding Slowly
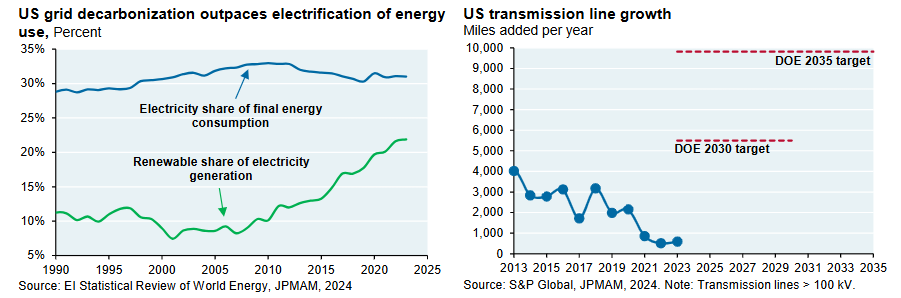
“Remember this key aspect of the energy transition: until an energy use is electrified, it’s hard to decarbonize it using green grid electrons. And while grid decarbonization is continuing at a steady pace, the US has made little progress increasing the electricity share of final energy consumption for the reasons discussed in last year’s “Electravision” piece. One major obstacle: transmission line growth is stuck in a rut, way below DoE targets for 2030 and 2035. Another obstacle: shortages of transformer equipment, whose delivery times have extended from 4-6 weeks in 2019 to 2-3 years. . . “
The panel on the rgiht above indicates that the U.S. was never going to meet the emissions reduction targets of the Biden Administration — which has been clear for several years now.
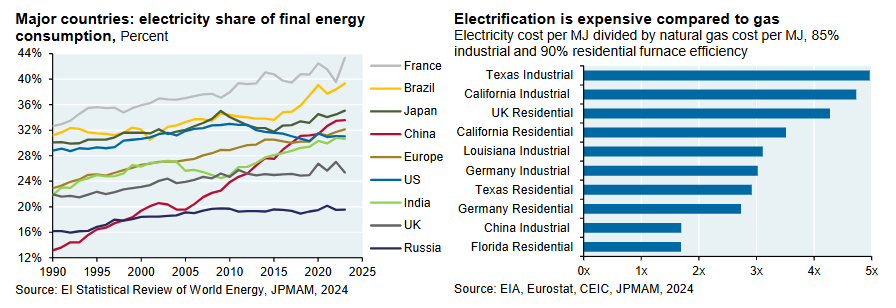
“The US is not unique with respect to the slow pace of electrification, although a few countries are making faster progress. Over the last decade China made the largest advance, bringing it in line with the OECD. Part of the challenge may simply be the long useful lives of existing industrial plants, furnaces, boilers and vehicles. In other words, electrification might accelerate as their useful lives are exhausted. But as shown on the right, the high cost of electricity compared to natural gas (particularly in places without a carbon tax) is another impediment to electrification that is not easy to solve since this ratio reflects relative total costs of production and distribution.”
A low carbon tax still makes very good sense.
Energy Dependence and Independence
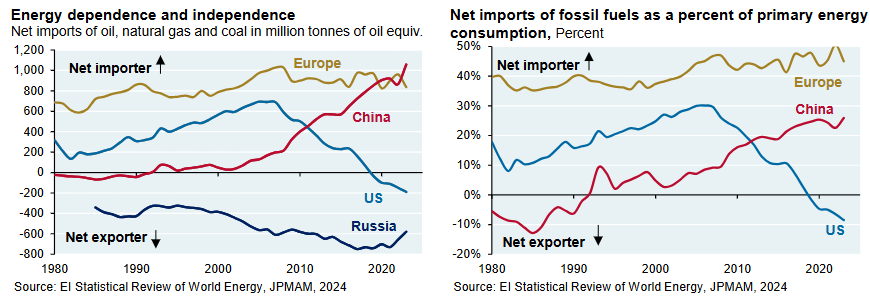
“The US has achieved US energy independence for the first time in 40 years while Europe and China compete for global energy resources. China’s imports are similar to Europe in energy terms but half as much as a share of domestic energy consumption. Energy intensive manufacturing has shifted to the developing world since the mid 1990’s. China is negotiating with Russia and Turkmenistan regarding future gas pipeline projects. China has the benefit of time: China gas imports are projected to reach 250 bcm by 2030 vs 170 bcm in 2023, almost all of which can be met by already contracted supplies. What was Taiwan thinking by shutting down nuclear power which has fallen from 50% to 5% of generation? Taiwan is now one of the most energy dependent countries in the world, resulting in rising economic costs if China were to impose a blockade.”
The Trump administration’s trade war with Canada risks upending North America’s energy dominance. What can they be thinking?
Fossil Fuels Falling and Rising
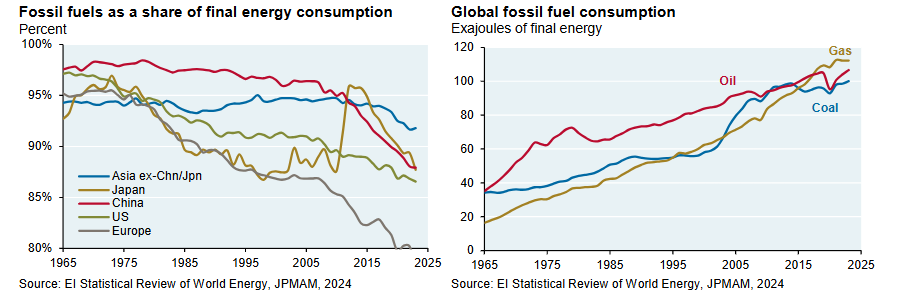
“Fossil fuel shares of final energy are falling faster in China, Japan and Europe than in the US. Growth in fossil fuel consumption is slowing but no clear sign of a peak on a global basis. Hydraulically fractured oil and gas account for 60%+ of US primary energy consumption. Global LNG export capacity is set to expand by one third by 2030. Coal consumption is roughly flat in final energy terms as rising EM consumption offsets falling OECD consumption.”
Yesterday, US Secretary of Energy Chris Wright spoke at an energy conference in Houston, and his remarks have been transcribed by Robert Bryce. Here is an excerpt:
Let's do a quick survey of energy access today. Roughly one billion people live lives remotely recognizable to us in this room. We wear fancy clothes, mostly made out of hydrocarbons. We travel in motorized transport. The extra lucky of us fly across the world to attend conferences. We heat our homes in winter, cool them in summer, store myriad foods in our freezers and refrigerators, and have light, communications and entertainment at the flip of a switch.
Pretty awesome.
This lifestyle requires an average of 13 barrels of oil per person per year. What about the other seven billion people? They want what we have. The other seven billion people, on average, consume only three barrels of oil per person per year versus our 13. Africans average less than one barrel.
We need more energy. Lots more energy. That much should be obvious.
Read Wright’s speech alongside Cembalest’s energy analysis — We are at long last in an era of energy realism.
The easiest thing you can do to support THB is to click that “♡ Like”. More likes mean that THB gets in front of more readers!
Comments welcomed! What parts of the JP Morgan report do you find most interesting?
THB is reader supported. Please consider a subscription or an upgrade to support work like that you just read.
Excellent summary. The chart showing the difference between solar energy production and actual solar energy consumption is something most people don’t understand. While solar occupies an elegant niche role, it has little chance of playing a major part in energy consumption unless battery prices were to plummet. I don’t see that happening within the “climate Armageddon “ time frame we hear so much about.
Really good, sobering analysis. But I fail to see Roger's continued bullishness on solar, it's expensive, intermittent and just isn't doing much. A waste of time, money and effort, imo. And a low carbon tax does nothing but artificially raise the price of energy, it's a downer overall and serves mainly to decrease the world's standard of living. A transfer of money from individuals to governments which is mostly wasted and redistributed to the well connected wealthy elite. Just bad policy.