SERIES: Making Sense of Science in Policy and Politics
Part 2: Perils of the “Garden of Forking Paths”
Note: This post is Part 2 of a series. You can read Part 1 here.
In 2014, statisticians Andrew Gelman and Eric Loken characterized the many methodological choices made by researchers exploring a hypothesis as a journey through a “garden of forking paths.” Once one arrives at a destination – research results in this case -- the route taken can seem “predetermined, but that’s because the choices are done implicitly.” Gelman and Loken warn that research results may have turned out differently, had different choices been made.
A practical illustration of the significance of the “garden of forking paths” in research can be found in a fascinating 2018 paper by Raphael Silberzahn and colleagues. They reported on the results of giving one dataset to many research teams.
“Twenty-nine teams involving 61 analysts used the same data set to address the same research question: whether soccer referees are more likely to give red cards to dark-skin-toned players than to light-skin-toned players.”
It turns out that the 29 different research teams chose many different methodological approaches to answering the research question – they took different paths. And the different paths led to different destinations:
“Twenty teams (69%) found a statistically significant positive effect, and 9 teams (31%) did not observe a significant relationship. Overall, the 29 different analyses used 21 unique combinations of covariates. Neither analysts’ prior beliefs about the effect of interest nor their level of expertise readily explained the variation in the outcomes of the analyses. Peer ratings of the quality of the analyses also did not account for the variability. These findings suggest that significant variation in the results of analyses of complex data may be difficult to avoid, even by experts with honest intentions.”
That different researchers can ask the same question but employ different methods (often using different data) and arrive at different, even conflicting, results is of course a basic characteristic of scientific research.
More than two decades ago, Dan Sarewitz characterized the resulting situation as an “excess of objectivity”:
As an explanation for the complexity of science in the political decision making process, the “excess of objectivity” argument views science as extracting from nature innumerable facts from which different pictures of reality can be assembled, depending in part on the social, institutional, or political context within which those doing the assembling are operating. This is more than a matter of selective use of facts to support a pre-existing position. The point is that, when cause-and-effect relations are not simple or well-established, all uses of facts are selective.
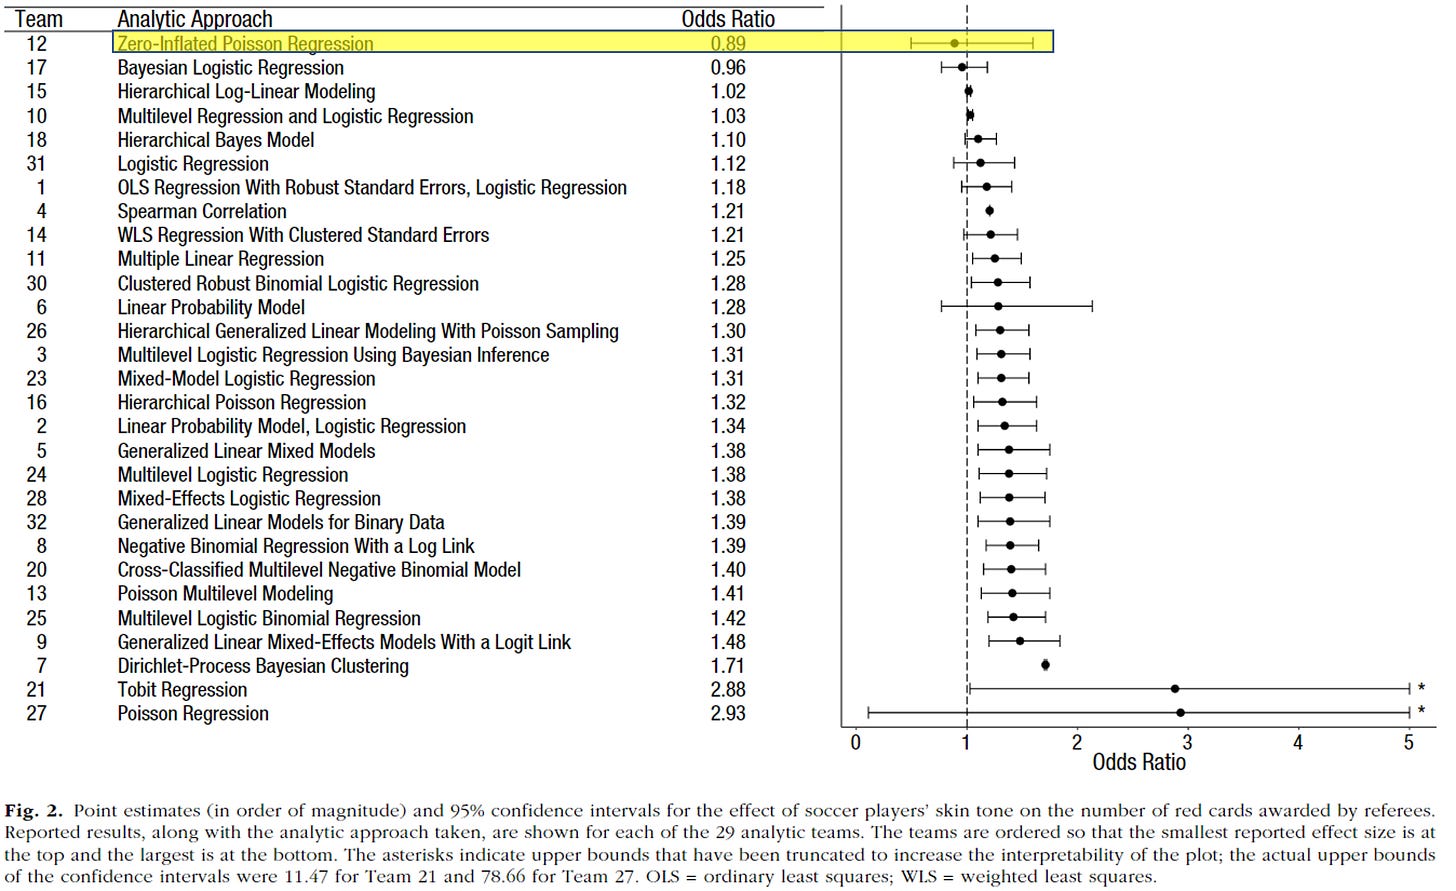
Let’s return to the study of whether red card decisions in soccer are influenced by the player’s skin tone. The figure below shows the title of the approach used by each of the 29 teams of researchers and their results. If the whiskers in the plot cross the vertical dashed line, then that means the research team did not find a statistically significant relationship of red cards given and player skin color. I have highlighted one study in yellow — the strongest finding of the 9 studies that found no significant relationship.
Imagine that the study highlighted in yellow above is the result of a stand-alone research paper and upon its publication my university issues a press release titled: NO RELATIONSHIP BETWEEN RED CARDS AND PLAYER SKIN COLOR, STUDY FINDS. This finding then makes its way into newspaper headlines around the world. Referees rejoice! Advocates against racism in football complain!
Would there be any problem with this situation? You might register some of he following objections:
The study in the press release is just one of many;
20 other studies have found a significant relationship, and 9 did not;
It looks like one study has been cherry picked;
Neither science nor policy are improved by this situation.
Note that nothing in the above hypothetical requires anyone to be acting in bad faith or seeking to promote a particular agenda. The normal conduct of research can result in a diversity of findings that can be arrayed in many different ways.
The hypothetical above illustrates clearly how science can easily be caught up in or even created for advocacy for a particular position. The 29 “studies” on the table above might be thought of as a bowl of cherries from which advocates for or against a cause (e.g., racism in soccer in this instance) can pick and choose as serves their needs. These advocates could of course include scientists, including those wandering around in the “garden of forking paths” with a particular destination in mind.
The dynamics described above are more than just theoretical. Here are three real-world examples taken from my recent work that look a lot like the hypothetical illustrated above.
Climate scenarios

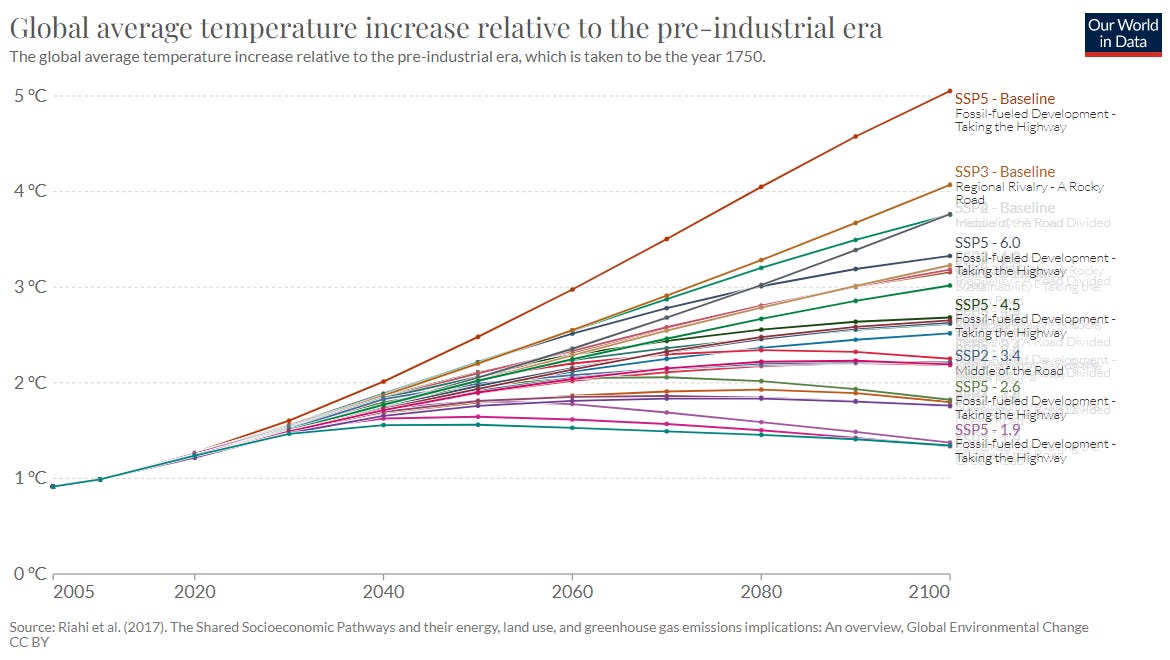
The figure above shows most recent set of scenarios used by the Intergovernmental on Climate Change, called Shared Socioeconomic Pathways (SSPs). There are 26 scenarios shown here, which themselves are a subset of 1,815 scenarios of the IPCC 6th Assessment (AR6). The IPCC assigned no likelihood or probability to these scenarios, they are all by definition supposed to be plausible futures.
Despite this, one scenario is favored over all others in climate research and assessment. The most frequently used scenario in climate research and that which is cited most often in the IPCC 6th Assessment is the one you see at the very top, labeled SSP5-Baseline, the most extreme scenario of the set. As I’ve frequently written, this scenario is well out-of-date and is already implausible (if you’d like a deeper dive, see this article).
The IPCC and Normalized Disaster Losses
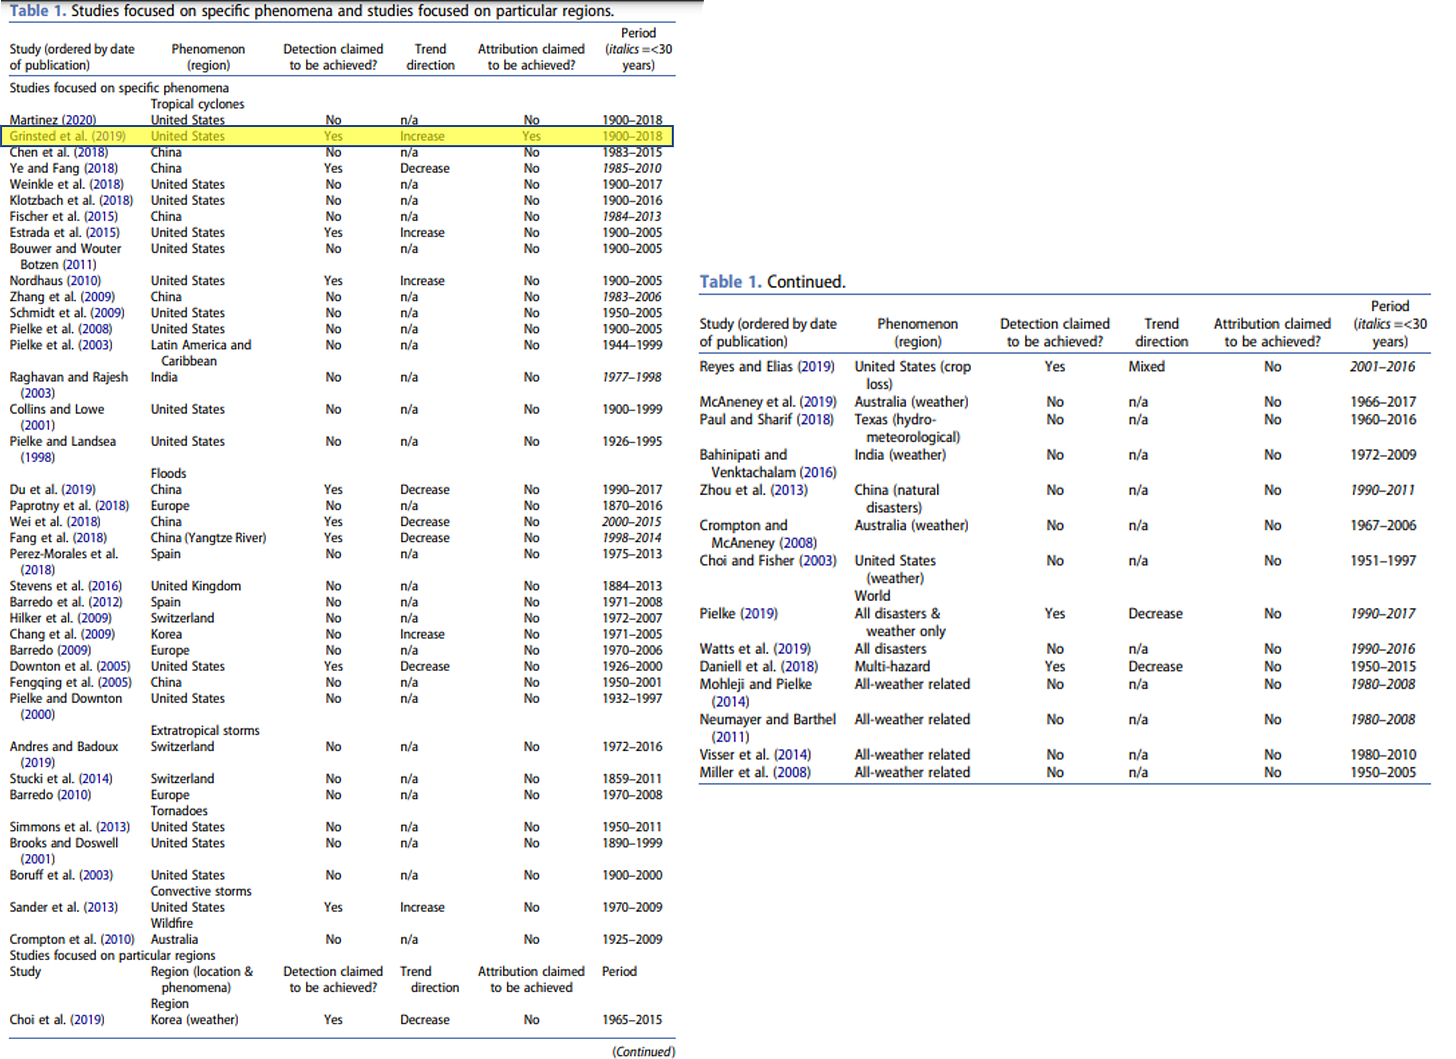
In 2021, when the IPCC AR6 Working Group 1 report came out I was pleased to see that it recognized the literature on “normalized” disaster losses — estimates of what damage past extreme events would cause under today’s societal conditions — since I helped to develop that literature starting in the 1990s. Earlier in 2021, I published a review of more than 50 studies that employed normalization methodologies to different phenomena and for different locations around the world.
Of these studies only one claimed to have both detected a signal of climate change in the normalized loss records and also attributed that change to the emissions of greenhouse gases. That single paper is highlighted in yellow above. It is also the only normalization paper of these 54 papers that was cited in the IPCC AR6 WG1 report.
Pakistan Floods
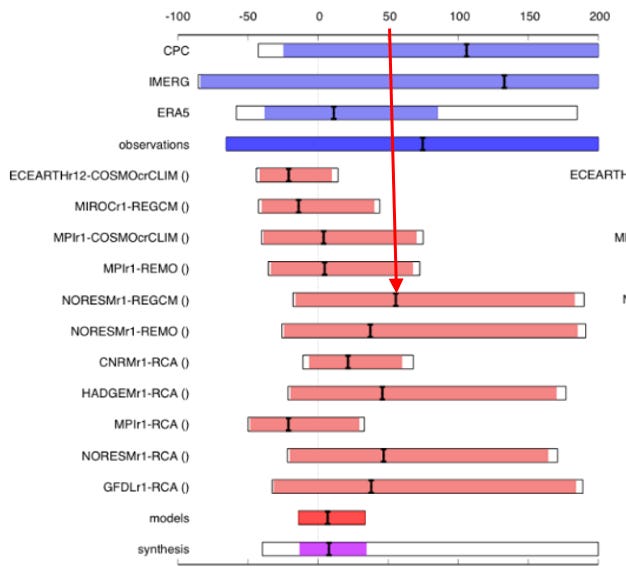
The figure above comes from a report last week by World Weather Attribution, which produces quick analyses of extreme weather events and their relationship to climate change. The light red bars show results from 11 different climate models for how climate change may have affected precipitation (measured over 5 consecutive days) in Pakistan this summer. The black lines represent the median result of each model. The dark red bar and its black line (second-to-bottom) shows results aggregated across all the models.
I placed the red arrow on the figure to illustrate the one model that was selected to emphasize in the WWA press release: “Some of these models suggest climate change could have increased the rainfall intensity up to 50% for the 5-day event definition.” This statement was picked up by the media and amplified around the world. No mention was made of the fact that one model indicated decreased rainfall intensity by about 40% and the models together showed no effect of climate change.
Advocacy and the “Garden of Forking Paths”
I have no idea why the WWA chose to emphasize one of 11 model results in its discussion of Pakistan’s floods. Nor do I have any idea why the IPCC chose to cite only one paper of more than 50 utilizing normalization methods. Because I’ve studied it in depth, I do have some idea why the climate community has come to rely on the most extreme scenarios in research and assessment, and the answer is — it’s complicated. I also have little insight as to why virtually no researchers and no reporters highlight these issues, which are regularly discussed in other fields of research and also routinely characterized as problematic.
What I do know is that in each of the instances above, the path through the “Garden of Forking Paths” leads to a destination that would appear to support claims that climate change is worse than the evidence actually suggests. Perhaps scientists and journalists think they are helping to advocate for climate policy by letting selective interpretations of climate science and cherry-picked results stand unchallenged. I welcome hearing from scientists and journalists their views on this question — email me if you are worried about speaking publicly.
What I also know is that effective policy depends upon producing the best science that we can, where best is judged not by its political role in supporting advocacy, but by well-established standards of scientific quality. That is especially the case when research is uncertain, unwelcome or uncomfortable. Each us has a responsibility to guard against the perils of exploring the “garden of forking paths,” and both science and policy will be better for it.
I’ll let Silberzahn and colleagues have the last word for today, please read their last sentence twice:
“Uncertainty in interpreting research results is therefore not just a function of statistical power or the use of questionable research practices; it is also a function of the many reasonable decisions that researchers must make in order to conduct the research. This does not mean that analyzing data and drawing research conclusions is a subjective enterprise with no connection to reality. It does mean that many subjective decisions are part of the research process and can affect the outcomes. The best defense against subjectivity in science is to expose it.”
Paying subscribers to The Honest Broker receive subscriber-only posts, regular pointers to recommended readings, occasional direct emails with PDFs of my books and paywalled writings and the opportunity to participate in conversations on the site. All paid subscribers get a free copy of my book, Disasters and Climate Change at this link. I am also looking for additional ways to add value to those who see fit to support my work.
There are three paid subscription models:
1. The annual subscription: $80 annually
2. The standard monthly subscription: $8 monthly - which gives you a bit more flexibility.
3. Founders club: $500 annually, or another amount at your discretion - for those who have the ability or interest to support my work at a higher level.


Crisp and concise, Roger. Just the way I like it.
One of your best postings. I would be very interested in hearing why anyone would or could disagree with what you've written.