Secret Sauce
You'll Never Guess What Drives the Biden Administration's Social Cost of Carbon
Last Friday, the Biden Administration announced new regulations on methane emissions — regulations which I think are a very good idea.1 Noah Kaufman of Columbia University and who formerly served as Senior Economist at the Council of Economic Advisers under President Biden posted the Environmental Protection Agency’s (EPA’s) cost-benefit analysis for the regulations and asked on X/Twitter:
Is this the first time positive net monetized benefits of a federal regulation hinge on the climate benefits?
If so, then this would also be the first federal regulation which demonstrated positive net benefits based on the misuse of the implausible extreme climate scenario RCP8.5. Today, I expose RCP8.5 as the secret sauce in the Biden Administration’ “social cost of carbon” or SCC.
The SCC is supposed to tell us how much damage will result from emissions of carbon dioxide, and thus is intended for use in cost-benefit analyses.2 The SCC is created using highly technical and opaque methods. It is based on assumptions built on assumptions across a sprawling literature that spans decades and it can be difficult even for experts to know how it is produced.
I don’t think much of the SCC — it is science-like but not science. But if it is going to be used as a basis to justify policy, then it should not be based on flawed, outdated or erroneous science. Everyone should be able to agree on that.
The flowchart below from EPA’s supplementary material accompanying the new regulations illustrates the components of SCC estimation. Earlier this year, when the Biden Administration released its new approach to the SCC, I observed here at THB that its emissions projections — in the green box I added below — had abandoned RCP8.5 or anything close to it. That was indeed big news.
However, I was too optimistic, as RCP8.5 lives on in the SCC — and boy does it — in the red box below, the damages module.

At the center of the damages module are “damage functions” — EPA explains:
“Damage functions translate changes in temperature and other physical impacts of climate change into monetized estimates of net economic damages.”
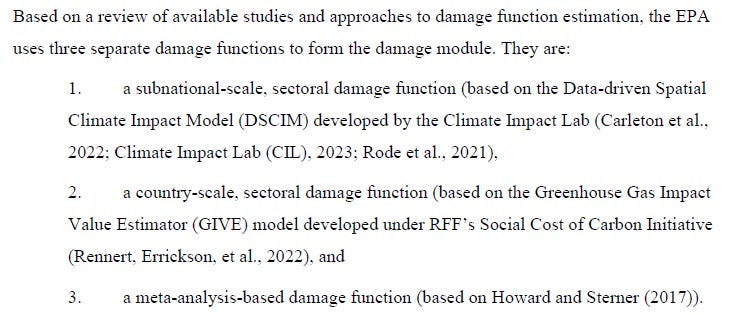
A damage function is simply a curve that equates temperature changes with expected damages. President Biden’s EPA utilizes three damage functions, as described in the image below.
The damage functions are where RCP8.5 sneaks in and steals the show. Each of these damage functions is based on RCP8.5 and not EPA’s emissions scenarios or climate projections. Sneaky. Uncool. Not science.
Let’s take a quick look at each of the three damage functions and document how RCP8.5 gets into the mix.
Data-driven Spatial Impact Climate Model (DSICM) of the Climate Impact Lab
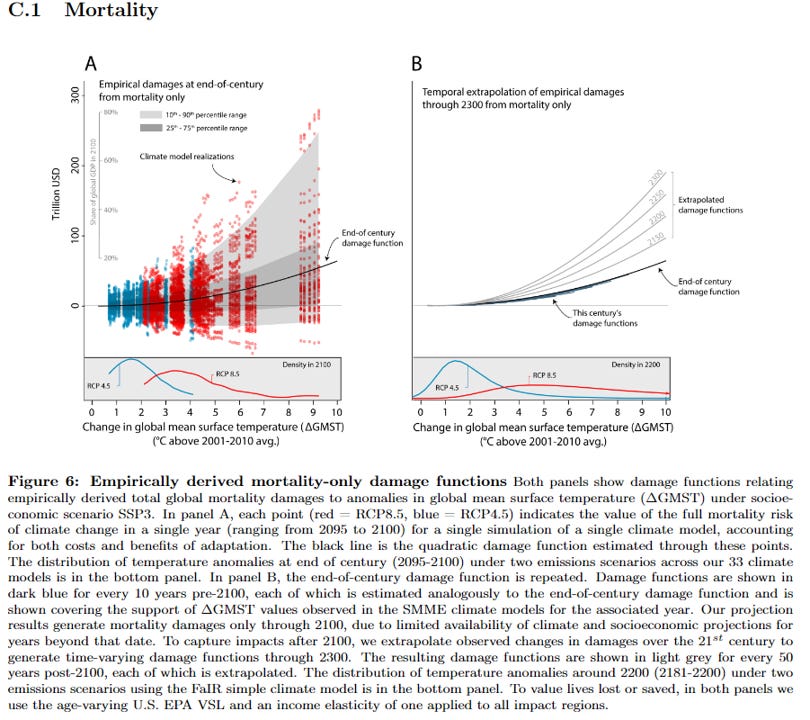
The multiple damage functions (for health, energy, labor, agriculture and coasts) that result from DSCIM rely on RCP8.5, as you can see in the figure below. The figure shows that DSCIM has paired RCP8.5 with SSP3 — a major methodological error.3 You can also see that the resulting damage function (Panel B) incorporates projected changes in global average surface temperature of 10 degrees Celsius above 2001-2010 levels by 2100. No one thinks that is remotely plausible.
If you squint carefully at the figures above and ignore the red dots representing SSP3-8.5 you’ll see that there is essentially no damage out to about 2 degrees C, which equates to ~3C above preindustrial values. The world is currently on track to see warming of less than 2.5C.
More than 75% of the DSCIM SCC results from mortality due to extreme heat, driven by RCP8.5, as you can see in the figure below from Carlton et al. 2022.

The sector with the second-greatest contribution to the DSCIM SCC estimate is labor, and this too is based on RCP8.5. Take away RCP8.5, and the DSCIM SCC is just about zero.
Greenhouse Gas Value Impact Estimator (GIVE) from Rennert et al. 2022
The GIVE approach employs a damage function that is a mash-up of various studies, which we can examine one-by-one:
Sea level rise comes from Diaz 2016 which uses RCP8.5.
Building energy expenditures relies on Clarke at al. 2018 which uses RCP8.5.
Agriculture relies on Moore at al. which uses RCP8.5.
Health uses Cromar et al. 2021 which is not projective, and concludes that increases in temperatures cause more deaths than lives saved by decreases in cold temperatures, contrary to the broader literature, e.g., Gasparrini et al. 2015 and Lee and Dessler 2023. GIVE also does not consider future adaptation, which we know can eliminate health impacts from increasing temperatures.
With GIVE as well, if we eliminate RCP8.5 (responsible for about 50% of the GIVE SCC) and correct the flawed assumptions on temperature change effects on mortality (about the other 50%), then the GIVE SCC is also about zero.
If you take a look at the sectoral breakdown of SCC between DSCIM and GIVE you see an enormous variation in results, as shown in the table below, illustrating the plasticity of the SCC.
A SCC estimate can be made whatever you’d like it to be, simply by varying assumptions. However, utilizing RCP8.5 to create damage functions sure does help make the SCC larger.
The meta-analysis of Howard and Sterner (2017)
The third damage function used by EPA relies on a meta-analysis of papers published 2015 and earlier. The meta-analysis is quite dated but still incorporates analyses that use RCP8.5 as the basis for calculating the SCC, such as Burke et al. 2015.
Of the 43 SCC estimates that comprise the meta-study, 18 were published before 2000 and 29 before 2010. RCP8.5 wasn’t published until 2011, however, many of the studies in the meta-study use its antecedents.
Importantly, Howard and Sterner (2017) highlight the influence of extreme projections on their estimated SCC:
“When we exclude high-temperature estimates (i.e., >4°C) . . . we find evidence of initial benefits from climate change.
When we include high-temperature estimates (>4°C), we find . . . no initial benefits from climate change and a flatter damage function. . .
. . . we also find that the inclusion of the sole high-temperature estimate . . . significantly impacts the final coefficients and the corresponding SCC estimate. Together, these results again highlight the sensitivity of the temperature-damage relationship to high-temperature damage estimates.”
A lot of work is done in SCC estimates by high temperature projections extended out to 2300.
How RCP8.5-Based Damage Functions Bias SCC Estimates
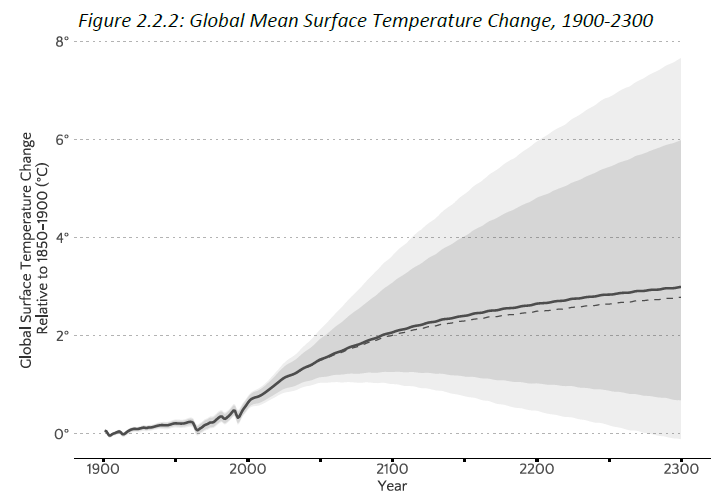
The image above shows the temperature ranges used in the EPA SCC calculations (mean value is the solid line, median is dashed), which are centered at about 2 degrees Celsius in 2100, but extend to 2300 when they approach 8C on the upper end.
The projection shows that ~50% of the EPA SCC is based on projected temperature changes of ~3C to ~8C by 2300, representing huge changes in climate. You can see from the figure above that the spread of projected temperatures is skewed to higher levels.
Because damage functions based on RCP8.5 are non-linear, that means that EPA’s random sampling of projected temperatures from the above distribution, which are then fed into the EPA damage functions, will be disproportionately influenced by the assumptions of extreme temperatures, even though the 2100 midpoint appears reasonable.
RCP8.5 does the heavy lifting. That’s the secret sauce.
Thanks for reading this down-in-the-weeds post! Please share and bookmark — the SCC is going to be around for a while and surely will be contested. The details matter. THB is reader supported, and I appreciate all subscribers, at whatever level makes sense for you. Remember, I’ve got December’s AMA open here.
My judgment of the value of these regulations rests entirely on net-compliance costs and the non-monetized benefits, which you can see at Table 1-4 here.
The EPA also estimates the social costs of methane and nitrous oxide. In this post I focus on carbon, but a similar critique applies to these other greenhouse gases.
According to the DSCIM user’s manual, RCP8.5 is paired with SSP2, SSP3 and SSP4 — none of which even exist in model land. This is modeling malpractice.


Richard Tol just shared his new meta-analysis with me. Here: https://ideas.repec.org/p/arx/papers/2207.12199.html
I’m thinking that SCC is just a number used to justify what elements in the USG either already want to do, or want to regulate. In that sense it is a sciency marketing tool, not really used in setting policy, more in rationalizing policies they choose. Calculations suffer from the Great Maxim of Climate Projections, that somehow you can multiply and add numbers with large uncertainties and come out at the end with a number that is less uncertain than any of the numbers that went in. Abracadabra ish..