This is the 3rd guest post from Roger Pielke Sr. here at THB (Thanks Dad!). You can find his first two posts, on carbon dioxide and land use change, here.
Climate discussions focus on global average surface temperatures as the main target for climate policy – such as in the familiar 1.5 and 2 degree Celsius targets of the Paris Agreement. However, ocean heat content offers a far more robust metric for diagnosing global warming – in technical terms, a positive top of the atmosphere radiative imbalance — and which hereafter I’ll call the planetary radiative imbalance.
A 2003 paper of mine may have been the first to propose using ocean heat content change to quantitatively diagnose the planetary radiative imbalance as part of climate monitoring.
Of course, science is a cumulative endeavor. My motivation to associate ocean heat content changes with the radiative imbalance came from earlier work. Forty-five years ago, Ellis et al. related the annual warming and cooling of the Earth’s ocean to the global average planetary radiative imbalance. They presented this annual variation in heating rate in units of watts per meter squared (or W/m^2).
Understanding units of energy and energy transfer can be challenging. Before we continue, let’s briefly discuss the units of energy and energy transfer that are the focus of this post.
A watt is a unit that describes the transfer of energy. A watt per square meter refers to the transfer of energy over a square meter. A watt is a Joule per second and a Joule is a measure of energy. To illustrate, it takes 4,184 Joules to raise a kilogram of water(2.2 pounds, or about 4.25 cups) by 1 degree Celsius. If we apply one watt to our pot of water, for example, we need to do that for 4,184 seconds to increase that kilogram of water by one degree Celsius. The area of the sphere represented by the top of Earth’s atmosphere (technically, at the tropopause for estimates of radiative forcing) is more than 510 million square kilometers, so even a small increase in watts per square meter can result in a very large change in total planetary energy. It is also why values expressed in Joules are so large.
Back to ocean heat content . . .
Ocean heat content is the energy that accumulates in the ocean as a result of the planetary energy imbalance due to added carbon dioxide, other greenhouse gases, aerosols and other human and natural forcings. Most of this accumulating energy in the overall planetary system winds up in the oceans.
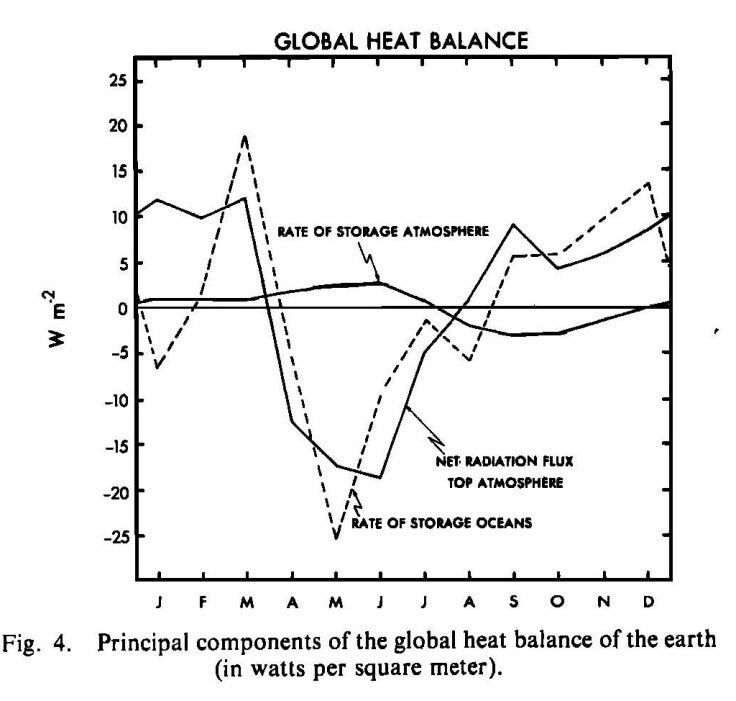
The Earth has a naturally occurring annual cycle in its energy balance, which is clearly illustrated in the figure below from Ellis et al. 1978. The figure shows that the planetary radiative imbalance (expressed here in W/m^2) is closely related throughout the year to changes in the ocean heat content.
The annual cycle of global warming and cooling is also evident in the figure with the planet gaining heat in the Northern Hemisphere fall and winter, and losing it in spring and summer. This cycle occurs because of the different amounts of ocean and land in each hemisphere (which absorb and radiate heat differently), the variation of the Earth’s orbital distance from the Sun during the year, and the Earth’s tilt in relation to the sun at different times of the year.
When there is a positive radiative flux over a period of time — that is, accumulating energy in the Earth system — the global climate system warms, and similarly global cooling results if the radiative fluxes are negative. As seen in the figure above, there is essentially no time lag between when a radiative imbalance occurs and the positive or negative accumulation of heat in the ocean. This is analogous to when you heat a pot of water. Once you turn off the stove, the heating of the water stops immediately because the energy being added to the system ceases.
The figure below from von Schuckmann et al 2023 quantifies where the accumulating energy goes within the Earth system. It shows that approximately 90% of the heat storage goes into the ocean.
An advantage of using ocean heat content change as a metric of global warming is that there is no “unrealized heat.” If the ocean heat content changes over a period of time sum to zero, then no additional heat has been added to the global climate system and there is correspondingly no global warming. This is a main reason why “net-zero” carbon dioxide (or greenhouse gases) makes sense – to restore the energy balance of the planetary system.
The notion of “heat in the pipeline” may be accurate if applied just to the atmospheric part of the climate system. The global average surface temperature could continue to increase even if the global radiative imbalance were to go to zero, since heat can be transferred over time between the oceans and the atmosphere.
One way this transfer occurs is via an increase in ocean surface temperatures (especially in the tropics and subtropics), as this will increase evaporation, which results in a warming of the atmosphere. Ocean surface temperatures — typically called sea surface temperatures or SSTs — are just the top level of the temperature measurements that comprise overall ocean heat content, although this top level is fundamentally important in the climate system as the interface between the ocean and the atmosphere.
Ocean heat content is calculated from the three-dimensional temperature profiles from the surface to a depth 2000m, whereas sea surface temperature typically refers to only the temperature of the top several millimeters of the ocean. In 2022, the global SST was about 0.6 degrees Celsius warmer than the 20th-century average, as you can see in the figure below.
Before the early 2000s, the measurement of ocean heat was not good enough to diagnose the top of the atmosphere global radiative imbalance. The introduction of the Argo Network has removed that limitation. The Argo network of buoys take vertical ocean soundings of temperature and salinity at many locations in the world’s oceans as shown in the figure below.
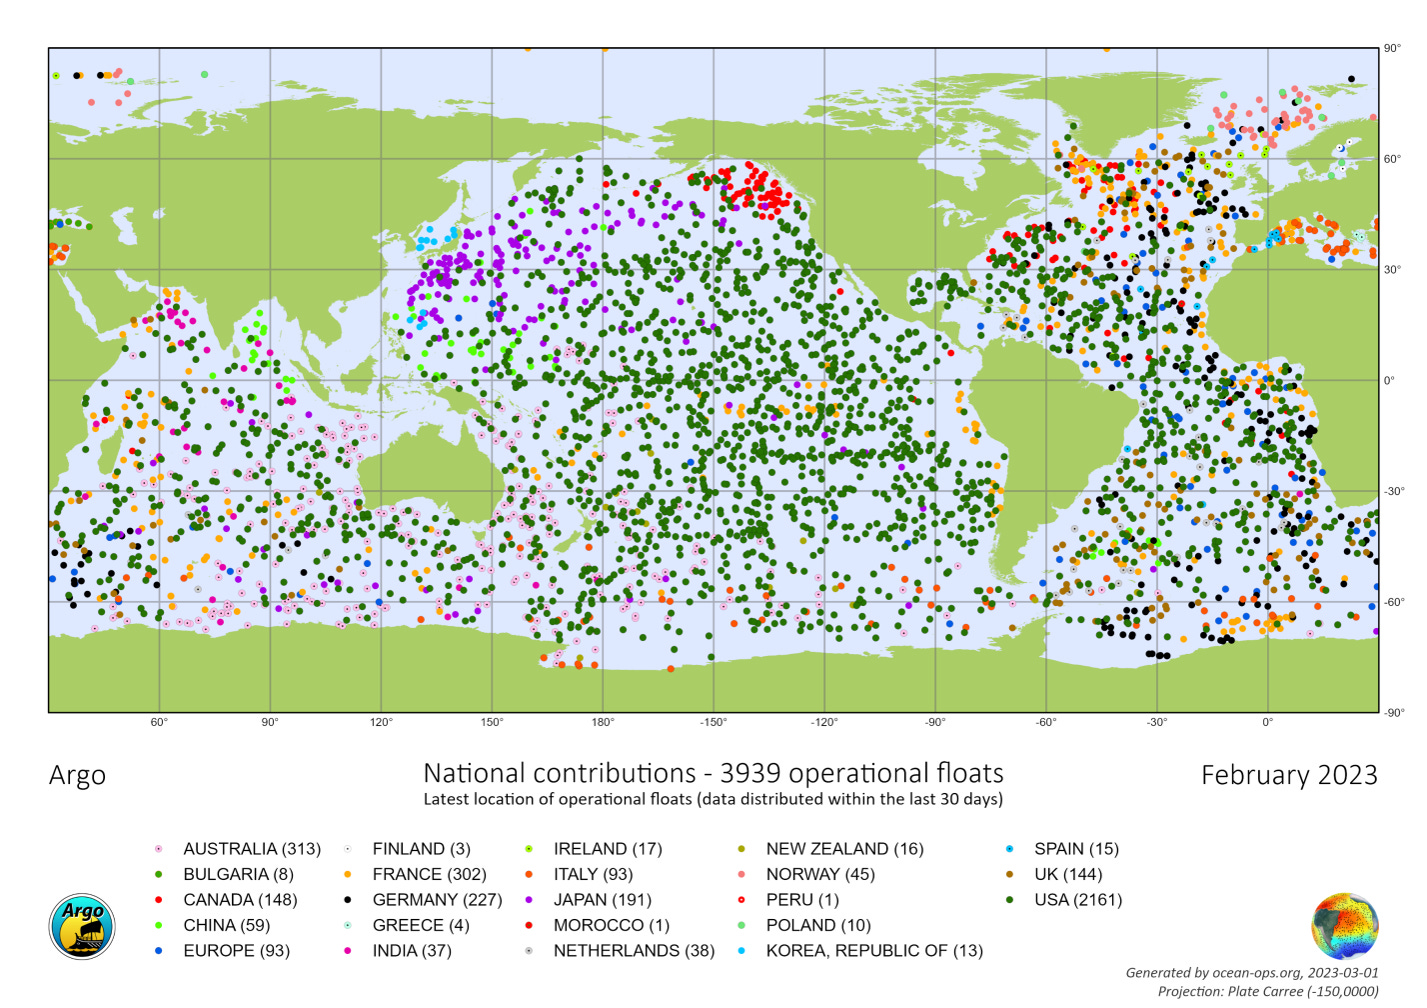
Coupled with satellite measurements, we now have 20 years of quality ocean heat content data, which is enough to perform a trend assessment. But be careful — Some articles with plots of ocean heat content kludge together time periods before 2003 with the post-Argo time periods. As the IPCC reminds us, only the recent period since 2003 is quantitatively robust.
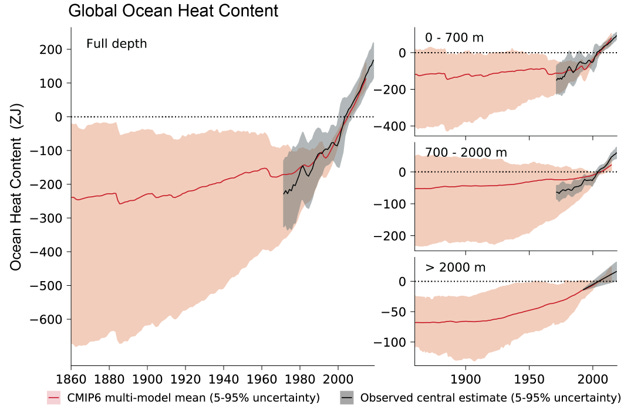
Below is a figure from the IPCC AR6 that shows ocean heat content change since the 1800s. The figure clearly illustrates the huge uncertainty in ocean heat content data prior to Argo. The figure also shows that heat that accumulates in the ocean is distributed at different depths, which is significant for understanding changes in climate that result from the planetary energy imbalance.
The visionaries who planned and implemented Argo should be thanked for this essential addition to the climate data set. The latest data on ocean heat content can be obtained from NOAA and the Japanese Meteorological Agency (JMA), among other places.
We can estimate the top of the atmosphere global average radiative imbalance for the time period since Argo data became available from the JMA observational analysis. Since 2003, the overall heating of the ocean was about 19.5 * 10^22 Joules (I told you it was a big number!). Using the IPCC estimate that 89% of the climate system heat accumulation goes into the oceans, the estimated total heat storage increase in the Earth system since 2003 is 10.67 *10^22 Joules per 10 years. Dividing by the area in meters squared of the Earth’s surface and converting 10 years to seconds, yields an estimated top of the atmosphere radiative flux of ~0.66 +/- 0.5 Watts per meter squared, roughly applying the uncertainty range in the above IPCC figure.
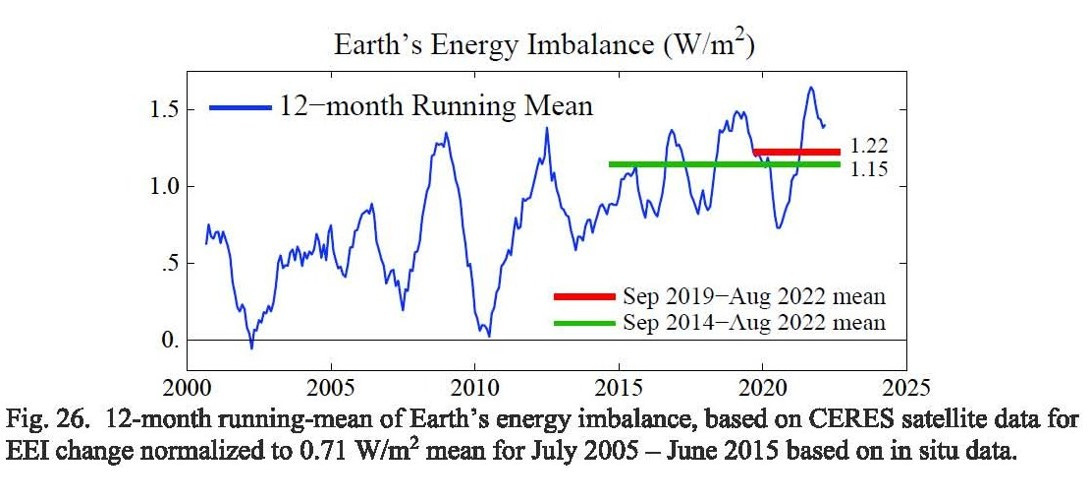
Recently, Hansen et al 2023 discuss the Earth’s energy imbalance and below is a figure from their pre-print.
They conclude that Earth’s energy imbalance has doubled since the first decade of this century. The values they report are from CERES satellite measurements of the radiative imbalance and are are well above what is estimated from other analyses that use ocean heat content data. I suspect the reason for the difference is their reliance on the CERES data. While these data are invaluable, to compute the planetary radiative imbalance directly from CERES requires an accurate determination of relatively small difference between two large numbers — the incoming and outgoing radiative fluxes from the Earth. In contrast, the ocean heat content change takes advantage of the inherent ability of spatial and temporal averaging to reduce errors and uncertainties in the observations. Thus longer term variations are easier to discern. In my view, Hansen et al.’s numbers would be more robust if they used ocean heat content to directly estimate the Earth’s energy imbalance.
A 2023 paper on the ocean heat content trends by Cheng et al. extends the assessment of ocean heat changes to near the present time, using two different datasets of OHC — one from China and the other from the US. Using the same approach I illustrated above using the JMA data, Cheng et al. converts to a warming rate of 0.76 +/- 0.5 W/m^2 (using the data from China) and 0.63 +/- 0.5 W/m^2 (using US data). These values are consistent with the 0.66 +/- 0.7 W/m^2 from the JMA analyses. In addition, von Schuckmann et al. found over 2006–2020 a global averaged heating rate of 0.76±0.2 W/m^2.
The different estimates of the planetary radiative imbalance discussed above are:
0.66 +/- 0.5 Watts per meter squared JMA (calculated above) [2003-present]
0.63 +/- 0.5 Watts per meter squared (Cheng et al. 2023). [2022]
0.76 +/- 0.5 Watts per meter squared (Cheng et al. 2023) [2022]
1.22 Watts per meter squared (Hansen et al. 2023) [2019-present]
0.76±0.2 per meter squared (von Schuckmann et al. 2023) [2006–2020)]
While the time periods for each are not identical, they are all for recent years when Argo data is available.
One of the insights from Argo is the better quantification of the observed heating at depth in the ocean. The IPCC figure above in its right panel shows this clearly. In addition, the spatial variation of ocean heating (such as with El Niño and La Niña ), also shapes the role of ocean heating in atmospheric response — affecting the weather that we experience.
A significant fraction of heating (e.g. ~35% of the total planetary radiative imbalance according the JMA) is transferred to deeper ocean depths below 700m. Once sequestered at depth, most of that heat is unlikely to be available to significantly affect the atmosphere — and thus weather — on a time period of perhaps decades, as heat transferred downward would need to be transferred back up across the ocean thermocline.
At depth, the heat is smeared spatially by deep ocean circulations, currents and turbulence and thus the heat is dispersed. To illustrate why this matters, consider a warm pocket of water in the upper 700m of the ocean. Then via ocean currents this pocket is transferred to below 700m. Turbulence and local ocean circulations below 700m will dilute this heat pocket over a larger volume. The warm water, originally a small volume, becomes cooler over a larger volume, while maintaining the same amount of heat. If this same original volume of water were then transferred upwards and back towards the surface of the ocean, it would carry with it a much smaller amount of heat per unit volume than the original pocket of water, thus reducing its effects on SSTs, atmospheric water vapor and atmospheric temperatures.
Accurately modeling these types dynamics is challenging.
For example, Irving et al. 2021 examine how well climate models can reproduce historical ocean heat content. Among their results, they report that the models representation of ocean heat drifts away from proper mass and energy conservation. Even after correcting for the drift, the models still do not accurately replicate the ocean mass budget. More work needs to be done to better represent ocean heating dynamics in climate models.
In another recent study, Kuhlbrodt et al. 2023 use ocean heat content observations for a detailed assessment of the simulated historical global and regional changes in four climate models (from CMIP6) -- two from the U.K. and two from CNRM. They report that four models share the same ocean component, yet temporal and spatial features are markedly different across the models. They conclude with the text that they find “striking differences between the models”. Here as well, more work needs to be done to understand and to skillfully project changes in ocean heat content and its effects on the atmosphere.
In conclusion, changes in ocean heat content as the primary metric to diagnose the top of the atmosphere radiative forcing as a metric of global warming has now become mainstream. To facilitate ongoing work, scientists should always present their results in units of Watts per meter squared, in addition to Joules, in order to more directly connect to the planetary radiative imbalance. This will also assist researchers who use climate scenarios, which are conventionally expressed in terms of radiative forcing levels. The planetary radiative imbalance based on ocean heat content changes provides a critically important test of the skill of the climate model predictions of future global warming and its consequences.
References
Cheng, L. J., et al. 2023: Another year of record heat for the oceans. Adv. Atmos. Sci., doi.org/10.1007/s00376-023-2385-2.
Ellis et al. 1978: The annual variation in the global heat balance of the Earth. J. Geophys. Res., 83, 1958-1962.
Irving, D., Hobbs, W., Church, J., & Zika, J. (2021). A mass and energy conservation analysis of drift in the CMIP6 ensemble. Journal of Climate, 34(8), 3157-3170.
Kuhlbrodt et al. 2023: Historical Ocean Heat Uptake in Two Pairs of CMIP6 Models: Global and Regional Perspectives. Journal of Climate. 36; 7
Meyssignac et al. 2019: Measuring Global Ocean Heat Content to Estimate the Earth Energy Imbalance Front. Mar. Sci., 20 August 2019 Sec. Ocean Observation
Volume 6 - 2019
Pielke Sr., R.A., 2003: Heat storage within the Earth system. Bull. Amer. Meteor. Soc., 84, 331-335.
von Schuckmann et al. 2023: Heat stored in the Earth system 1960–2020: where does the energy go?, Earth Syst. Sci. Data, 15, 1675–1709,





This was a particularly clear explanation of what is obviously a very complex, but important subject. Thank you, good Sir...
Yes. I agree there needs to be much more scrutiny of what is being reported in the media and even climate assessments.