
Mission Impossible
A simple analysis shows that U.K. cannot meet its net zero goals


Note: In my March column at The Dispatch, reproduced below, I update an analysis I first published back in 2009 evaluating the emissions reductions targets and timetables of the United Kingdom’s 2008 Climate Change Act. In that paper, I concluded:
The approach to emissions reduction embodied by the Climate Change Act is exactly backwards. It begins with setting a target and then only later do policy makers ask how that target might be achieved, with no consideration for whether the target implies realistic or feasible rates of decarbonization. The uncomfortable reality is that no one knows how fast a major economy can decarbonize.
Seventeen years later, that conclusion stood the test of time — and remains current under and updated anlysis based on experience since then along the latest legislated targets, as discussed below. Below the column, at the bottom of this post, paid THB subscribers can access details on the methods and a full Excel spreadsheet that allows replication and extension of the analysis. —RP
Today, I take a look at the oft-heralded story of the dramatic drop in greenhouse gas emissions in the United Kingdom under the 2008 Climate Change Act. The lessons are mixed. While the U.K.’s emissions reductions are indeed large, the country remains far off track for achieving its long-term targets, which have become even more aggressive in the 17 years since the law was passed. A closer look shows that the U.K.’s headline numbers are not quite as impressive as might be thought, as the country has relied on offshoring energy-intensive economic activity and other actions that take emissions off the national scorecard. Overall, the U.K. does not offer a model for emissions reductions that might be exported elsewhere.
Writing for the Financial Times last week, Martin Wolf offered a characteristically clear-eyed column on the United Kingdom’s commitment to reaching net-zero greenhouse gas emissions by 2050. Wolf’s argument: The U.K.’s headline emissions progress is less impressive than it looks. Much of its early success reflects the offshoring of energy-intensive manufacturing, and the U.K. economy remains overwhelmingly dependent on fossil fuels, with low-carbon electricity accounting for only 13 percent of total energy consumption in 2024 despite years of effort. Wolf is skeptical about the pace and political durability of the energy transition.
Unpacking Britain’s gains, both real and illusory, can offer valuable insight into how countries pursue their long-term emissions goals. A paper I published 17 years ago provides a methodology for evaluating the targets and timetables of the U.K. energy transition. My article, published in Environmental Research Letters, argued that the country’s Climate Change Act was on course to fail. Specifically, the emissions targets required rates of decarbonization—reductions in greenhouse gas emissions per unit of economic output—that were practically implausible. Sixteen years of data later, the picture is more complicated than a simple “I told you so,” but the core arithmetic of decarbonization of the U.K. economy has not improved.
My 2009 analysis used the Kaya identity, a framework that decomposes greenhouse gas emissions into population, per capita income, the energy intensity of the economy, and the carbon intensity of energy. Since no government seriously proposes cutting emissions by shrinking the economy or the population, climate policy is a bet on one variable: reducing emissions per unit of gross domestic product or, in short, decarbonization.
The Kaya framework allows us to deduce the future annual rate of decarbonization implied by a given emissions target, given plausible assumptions about future economic growth. That implied rate can then be compared to what has actually been achieved historically.
Since its enactment in 2008, the U.K.’s Climate Change Act has been modified. In 2019, the original 80-percent-by-2050 target was replaced with a legally binding commitment to hit net zero in the same time frame. In 2021, the government codified a new climate timeline requiring a 78 percent reduction in greenhouse gas emissions from 1990 levels by 2035. These are much more aggressive targets than the ones I analyzed in 2009.
And the U.K. has seen its emissions drop dramatically. According to official figures, greenhouse gases emitted within the country—known as territorial emissions—in 2024 were 371 million metric tons of carbon dioxide (CO2) equivalent, which includes a basket of greenhouse gases, not just CO2. Those figures represent a decrease of 54 percent below 1990 levels. Britain’s Office for National Statistics reported that economy-wide greenhouse gas intensity fell from 560 to 160 metric tons of CO2-equivalent per million pounds of economic output between 1990 and 2023, an average annual rate of improvement of 3.8 percent. That rate of decarbonization is roughly double the historical baseline that I cited in my 2009 paper, and suggests a real acceleration from the baseline trend.
But this progress is not all that it may seem. First, as Wolf rightly notes, a focus on territorial emissions flatters the trend. Consumption-based emissions—the U.K.’s actual global footprint, including imports—have fallen only about 20 percent since 1990, compared to 54 percent on a territorial basis. As Wolf notes, a substantial portion of the apparent gains reflects the offshoring of energy-intensive production. The updated Kaya analysis below uses territorial figures because those are what the legal targets track.
Second, the territorial progress was overwhelmingly driven by the lowest hanging fruit: starting with the displacement of coal with gas in the 1990s, followed by a rapid buildout of wind and solar through the 2010s. The last U.K. coal power station closed in October 2024. That transition is complete. The power sector, once the dominant source of U.K. emissions, is now fifth on the list. But as Wolf’s analysis shows, the broader economy remains heavily dependent on fossil fuels, which represented 75 percent of primary energy in 2024, with transport, heating, and industry still largely unelectrified.
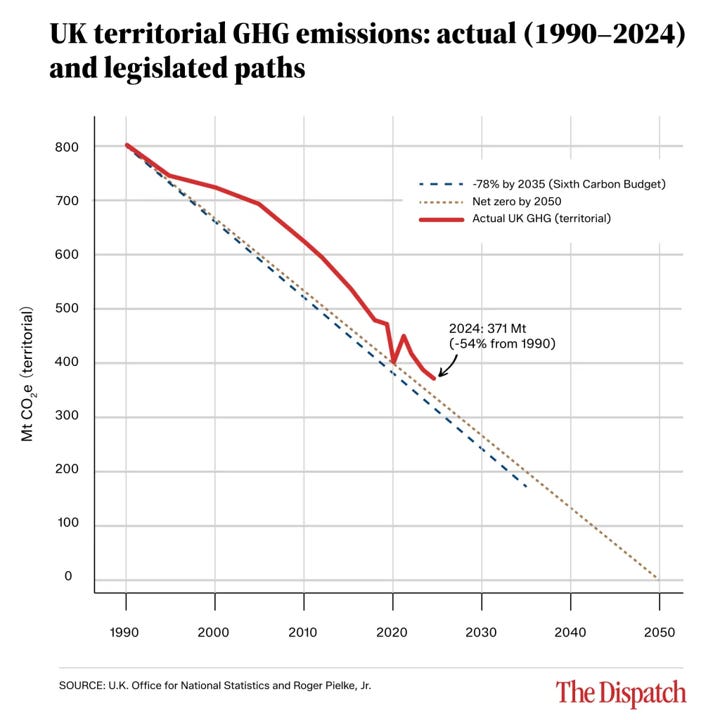
The graph above shows actual U.K. territorial greenhouse gas emissions from 1990 to 2024 alongside the required paths to the 2035 and 2050 targets.1 The progress is visually striking—and so is what still needs to happen for Britain to achieve its ambitious goals. Getting from 371 million metric tons of CO2-equivalent today to 177 million metric tons by 2035 requires cutting 194 million metric tons in 11 years, or roughly 18 million metric tons per year on average. The reduction from 2023 to 2024 was about 13 million metric tons. Therefore, the required pace of annual reductions going forward is about 40 percent faster than the recent trend, starting from the point at which the easiest reductions—switching off coal—have already occurred.
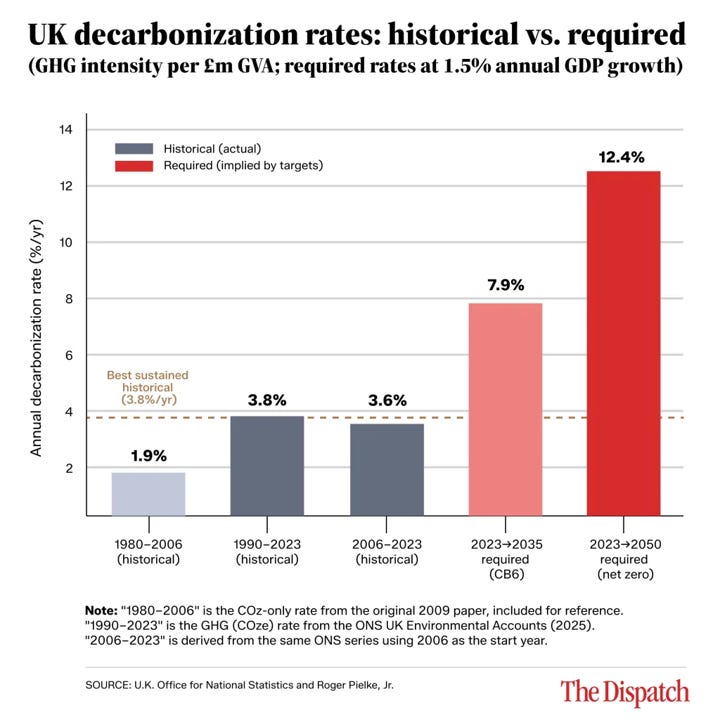
This chart translates those required emissions cuts into annual decarbonization rates and compares them to what the U.K. has actually achieved. The bars show the numbers plainly: The required rates going forward are far greater than the best sustained rate the U.K. has ever achieved—and that best rate was powered by a one-time structural transition that is now finished.
The required decarbonization rates are what the Kaya identity implies for an emissions reduction target and date, plus an assumption about future GDP growth rates. What the framework cannot tell us is whether those rates are achievable, which depends upon policy, politics, and technology. Consider that in 2009, solar power cost roughly 40 times what it does today. Offshore wind costs have fallen by 70 percent or more. Few anticipated such gains.
But as Wolf’s piece makes clear, the U.K. still faces significant obstacles in meeting its current targets. Accelerated decarbonization has to come from the sectors that are—as he documents—still overwhelmingly fossil-fuel dependent and largely unelectrified: transport, buildings, industry, and agriculture. These require not just cheaper, and in some cases, new technologies, but also the large-scale replacement or retrofitting of physical capital stock—homes, vehicles, industrial processes—at a pace and scale that has no historical precedent. The U.K. Climate Change Committee’s 2025 progress report puts it bluntly: 39 percent of the policies and plans needed to hit the U.K.’s 2030 climate target carry “significant risks, or insufficient or unquantified plans.”
My 2009 paper argued the Climate Change Act of 2008 was designed backwards, with targets coming before a feasibility assessment. That structural critique still applies, and the current targets are considerably more aggressive than they were in 2009.
The 54 percent territorial emissions reduction from 1990 is real, but taken alone, it is distorting on three counts: It excludes the emissions embedded in U.K. imports (consumption-based emissions have fallen only about 20 percent since 1990 by that measure); it excludes the emissions from electricity generated abroad and imported via interconnectors, which count against the generating country’s totals rather than the U.K.’s; and it excludes the CO2 from burning wood for electricity, which under standard accounting conventions is treated as zero in the energy sector—meaning the Drax power station, the U.K.’s single largest CO2 emitter at 13.3 million metric tons in 2024, does not appear in the headline total.
In 2026, the challenge the U.K. faces in reducing emissions has become harder, not easier: The targets have been tightened, the required decarbonization rates are higher than in 2009, and the remaining task is concentrated in the sectors most resistant to rapid change. The math has not improved.
Some countries, like the United States, also have low-hanging fruit in legacy coal generation whose retirement and replacement would reduce emissions. For other countries, coal remains synonymous with security of supply, especially now that natural gas supplies are facing severe disruption. More broadly, the offshoring of economic activity, slow economic growth, dependence on energy generated abroad, and other off-budget supply are not generalizable strategies for emissions reductions. The U.K.’s gains are notable. But they are also unique.
Comments, questions, critque, conversation — All welcome!
Methods and Data Below
Announcement: The annual subscription for new subscribers to THB is increasing to $100 on 1 June 2026! Lock in your support at a lower level, at a price that will never increase!
