Misinformation in the IPCC
Quality control lapses this serious are simply unacceptable
Last week I took a high-level look at the Intergovernmental Panel on Climate Change (IPCC) Sixth Assessment (AR6) Synthesis Report (SR) and suggested that it is time for reform of this important institution. The IPCC matters because climate change is a serious concern and mitigation and adaptation policies should be informed by accurate science.
Today, in the first of two posts, I explain how the IPCC made several misleading claims related to tropical cyclones. The IPCC’s failures are both obvious and undeniable. I will walk you through them in detail. Once again, I come to the conclusion that the IPCC needs reform. Mistakes can creep into massive assessments, to be sure, but the failures I document below are absolutely unacceptable.
The first failure never rose above the depths of Chapter 11 of its AR6 Working Group 1 (WG1) report. The second is a bit technical and is much more significant – having made its way into the Summaries for Policymakers (SPMs) of both WG1 and the Synthesis Report released last week.
Before proceeding, let me reiterate that the IPCC is not just one report or one group of people. It is many things and comprised of many different people. Its products are of uneven quality, and even individual chapters in the same report can be of very different scientific quality. For instance, in general, IPCC AR6 WG1 did a nice job on the physical science aspects of extreme weather, whereas IPCC AR6 WG2 was chock full of massive problems.
I support the IPCC and want it to be high quality across the board. We all have a responsibility to call out when the IPCC does not live up to its own high standards, because climate change is too important for bad science to appear in the world’s leading scientific assessment.
Grab a cup of coffee, have a seat and let’s go.
Pick Cherries to Make a Delicious Cherry Pie
The IPCC is supposed to review the scientific literature. All of it – that means including more than just a subset of studies which its authors wish to use to construct a narrative. It also means that the IPCC can’t ignore the research of those who its authors may find inconvenient. However, when it comes to U.S. hurricanes IPCC AR6 WG1 engaged in blatant cherry-picking of research.
Here is what the IPCC AR6 Chapter 11 (Ch.11 — oh my, so many acronyms!) stated about U.S. hurricanes:
A subset of the best-track data corresponding to hurricanes that have directly impacted the USA since 1900 is considered to be reliable, and shows no trend in the frequency of USA landfall events (Knutson et al., 2019). However, an increasing trend in normalized USA hurricane damage, which accounts for temporal changes in exposed wealth (Grinsted et al., 2019), and a decreasing trend in TC translation speed over the USA (Kossin, 2019) have also been identified in this period.
Read that carefully — The word “however” is used to suggest that a record of normalized U.S. hurricane damage can be used to contradict the gold standard “best-track data.” That is exactly backwards. You can’t use economic loss data to infer climate trends, much less use it to evaluate the validity of actual climate data. The IPCC knows better.
But it gets much worse.
In the paragraph above, Grinsted et al. 2019 (Note: All references in this post can be found at the bottom) is the sole source cited in support of the claim that there has been an “increasing trend” in normalized USA hurricane damage. Many readers here will know that I, along with NOAA’s Chris Landsea, first developed the concept and methodology of hurricane damage normalization more than 25 years ago. I know this literature as well as anyone.
So I am well aware that Grinsted et al. 2019 is an extreme outlier in the literature. It makes claims contrary to the overwhelming scientific consensus on this topic, which is that normalized damage trends match up well with trends in hurricane landfall frequency and intensity.
Of course, economic normalization and climate trends should match up, as consistency between a normalized loss record and independent climate data is an oft-applied test of the fidelity of a normalization methodology. If the trends do not match up, then that is a clear indication of a bias in the normalization methods.
The obvious conclusion here is that the inconsistency between trends in Grinsted et al. 2019 and those of the “best-track hurricane” data for US landfalls (one of the most reliable climate records you will find) indicates problems with Grinsted et al. 2019. Instead, the IPCC uses the inconsistency to suggest that the widely used “best-track data” is somehow in error. The IPCC is undercutting leading, consensus, official climate data. Remarkable.
Uncited by the IPCC are 8 other papers in the peer-reviewed literature, by about 20 authors using a range of different methods, each concluding that there has been no such “increasing trend” in normalized US hurricane losses. One of these papers even finds a sharp decrease in normalized US hurricane damage since 1900 (also contrary to observed trends in hurricanes, and thus biased). These eight studies are:
Martinez 2020
Weinkle et al. 2018
Klotzbach et al. 2018
Bouwer and Wouter Bozen 2011
Schmidt et al. 2009
Pielke et al. 2008
Collins and Lowe 2001
Pielke and Landsea 1998.
These 8 papers collectively have more than 2,600 citations. None were cited by the IPCC along with Grinsted et al. 2019, which has a paltry 65 citations since being published.
You won’t find a more obvious example of cherry-picking of the literature by the IPCC. Either that or its collective authorship was unaware of the literature that it was charged with assessing. I’m going with cherry-picking, as its authors are smart and knowledgeable. Unacceptable.
Climate Telephone
Here is second example on tropical cyclones that shows how the IPCC failed to accurately represent the literature that it was charged with assessing. This example is a bit more complicated (and involves many more acronyms, sorry), but once you see the details, it is no less obvious in the egregiousness of the failure.
The Summary for Policymakers of the IPCC AR6 Synthesis Report released last week includes this statement:
“Evidence of observed changes in extremes such as heatwaves, heavy precipitation, droughts, and tropical cyclones, and, in particular, their attribution to human influence, has strengthened since AR5.”
My attention was caught right away by the inclusion of tropical cyclones in the list of phenomena for which detection (of change) and its attribution (to greenhouse gas forcing) have been achieved. I know that statement is incorrect. IPCC AR6 WG1 Ch.11 states, correctly:
“There is low confidence in most reported long-term (multidecadal to centennial) trends in TC frequency- or intensity-based metrics”
And Ch.11 makes no claims of attribution of trends, which makes sense given the low confidence judgement. So how did a strong claim of detection and attribution for trends in tropical cyclones make it into the SPM of the AR6 SR? Let’s get to the bottom of the mistaken claim.
In the same paragraph the SR SPM states:
“It is likely that the global proportion of major (Category 3–5) tropical cyclone occurrence has increased over the last four decades.“
That paragraph is referenced to the SPM of IPCC AR6 WG1 as well as to the SPMs of the IPCC Special Reports on land and oceans (SRCCL and SROCC respectively). The IPCC special report on land does not mention tropical cyclones, but the SROCC does.
Here is what the SROCC SPM says (citing a 2014 paper that relies in part on our work):
There is emerging evidence for an increase in annual global proportion of Category 4 or 5 tropical cyclones in recent decades (low confidence). {6.2, Table 6.2, 6.3, 6.8, Box 6.1}
Chapter 6 of the SROCC explains the basis for the low confidence judgment:
“The lack of confident climate change detection for most TC metrics continues to limit confidence in both future projections and in the attribution of past changes and TC events, since TC event attribution in most published studies is generally being inferred without support from a confident climate change detection of a long-term trend in TC activity.”
We will return to the SROCC in a moment, but first, let’s next take a look at IPCC WG1 SPM, which has similar language to that in last week’s SR:
“It is likely that the global proportion of major (Category 3–5) tropical cyclone occurrence has increased over the last four decades . . .”
And the WG1 SPM also includes the low confidence judgment that is also found in the SROCC:
“There is low confidence in long-term (multi-decadal to centennial) trends in the frequency of all-category tropical cyclones.”
Let’s keep digging and go next to AR6 WG1 Chapter 11 to which these WG1 SPM statements are referenced. The executive summary of Chapter 11 has similar language and a footnote:
It is likely that the global proportion of Category 3–5 tropical cyclone instances [FN2] has increased over the past four decades.
The footnote [FN2] states:
Six-hourly intensity estimates during the lifetime of each TC.
This footnote is really important and it got lost somewhere in between Chapter 11 of the WG1 report and the SPM of the AR6 SR. To understand what happened, let’s compare the three statements found in the various documents, and I’ve emphasized the key change in wording:
IPCC AR6 SR SPM: “It is likely that the global proportion of major (Category 3–5) tropical cyclone occurrence has increased over the last four decades”
IPCC AR6 WG1 SPM: “It is likely that the global proportion of major (Category 3–5) tropical cyclone occurrence has increased over the last four decades . . .”
IPCC AR6 WG1 Ch.11: “It is likely that the global proportion of Category 3–5 tropical cyclone instances [FN2: Six-hourly intensity estimates during the lifetime of each TC.] has increased over the past four decades.”
The change from instance to occurrence completely changes the meaning of the claim. Let’s dig even deeper to see what is going on.
Deep in the full text of WG1 Chapter 11, it states (emphasis added):
“. . . a significant increase is found in the fractional proportion of global Category 3–5 TC instances (6-hourly intensity estimates during the lifetime of each TC) to all Category 1–5 in stances (Kossin et al., 2020).”
What in the world is a TC “instance”?
The source cited here is Kossin et al. 2020, a paper I know well (you can find several of my Twitter threads on it here and here). An “instance” as used here is an observation of a hurricane, it is not a hurricane itself. Kossin et al. 2020 analyzed observations of hurricanes, and not hurricane occurrence. They explain of their dataset:
“Over the period 1979–2017 considered here, there are about 225,000 ADT-HURSAT intensity estimates in about 4,000 individual TCs worldwide.”
This allows us to understand the confusion in the IPCC between “instances” and “occurrences.” As a result, the IPCC creates a few significant problems.
A first problem: Kossin et al. 2020 does not focus on the proportion of tropical cyclones, but the proportion of observations of tropical cyclones (called “fixes” in the operational tropical cyclone community and “exceedances” by Kossin et al. 2020) of at least hurricane strength that are observations of major hurricanes (Category 3+). In this game of IPCC telephone what was being observed and reported went from:
fixes, in the working terminology of the operational hurricane community
exceedances, in the bespoke jargon of Kossin et al. 2020
instances, as reported in IPCC AR6 WG1 Ch.11
to finally occurrences of tropical cyclones, in the IPCC AR6 WG1 SPM and IPCC AR6 SR SPM
Somewhere along the way the IPCC attached strong confidence in the detection and attribution of changes in “occurrences,” — both of which are completely detached from the substance of the article being cited to support the claims.
Kossin et al. 2020 make no claims about having achieved detection or attribution related to their analysis of “fixes”:
“Ultimately, there are many factors that contribute to the characteristics and observed changes in TC intensity, and this work makes no attempt to formally disentangle all of these factors. In particular, the significant trends identified in this empirical study do not constitute a traditional formal detection, and cannot precisely quantify the contribution from anthropogenic factors.”
When Kossin et al. 2020 first came out I pointed out on Twitter its widespread misinterpretation, as you can see below.


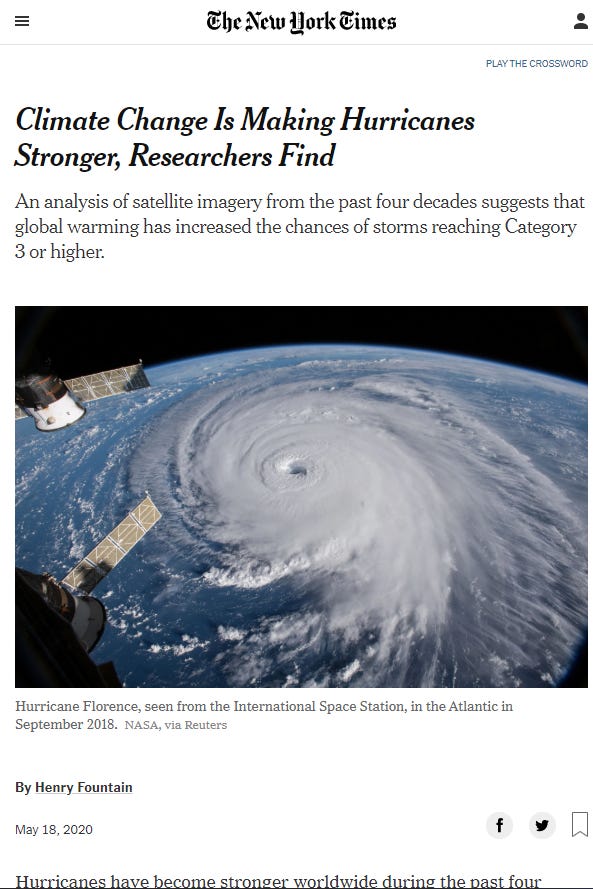
A second problem, and this is a big one. Kossin et al. 2020 was published in May, 2020. Less than 6 months later it was followed up by a massive correction.
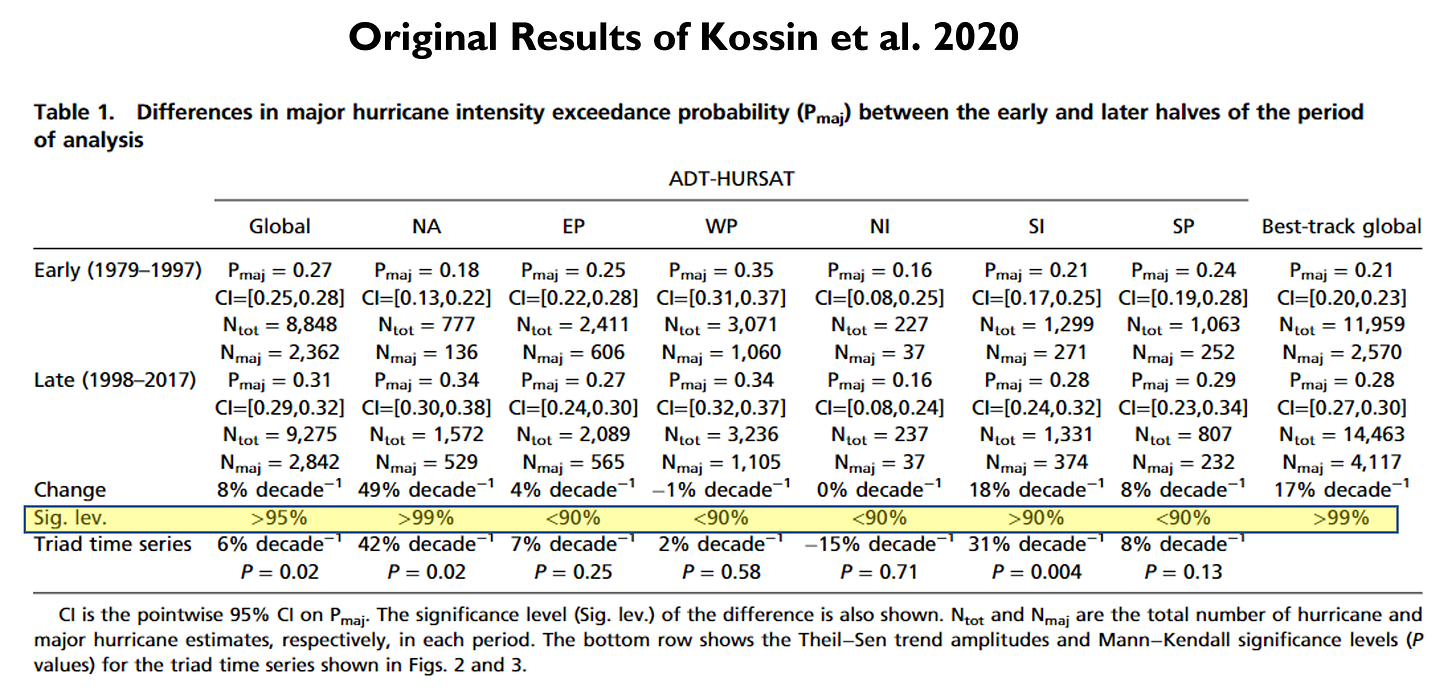
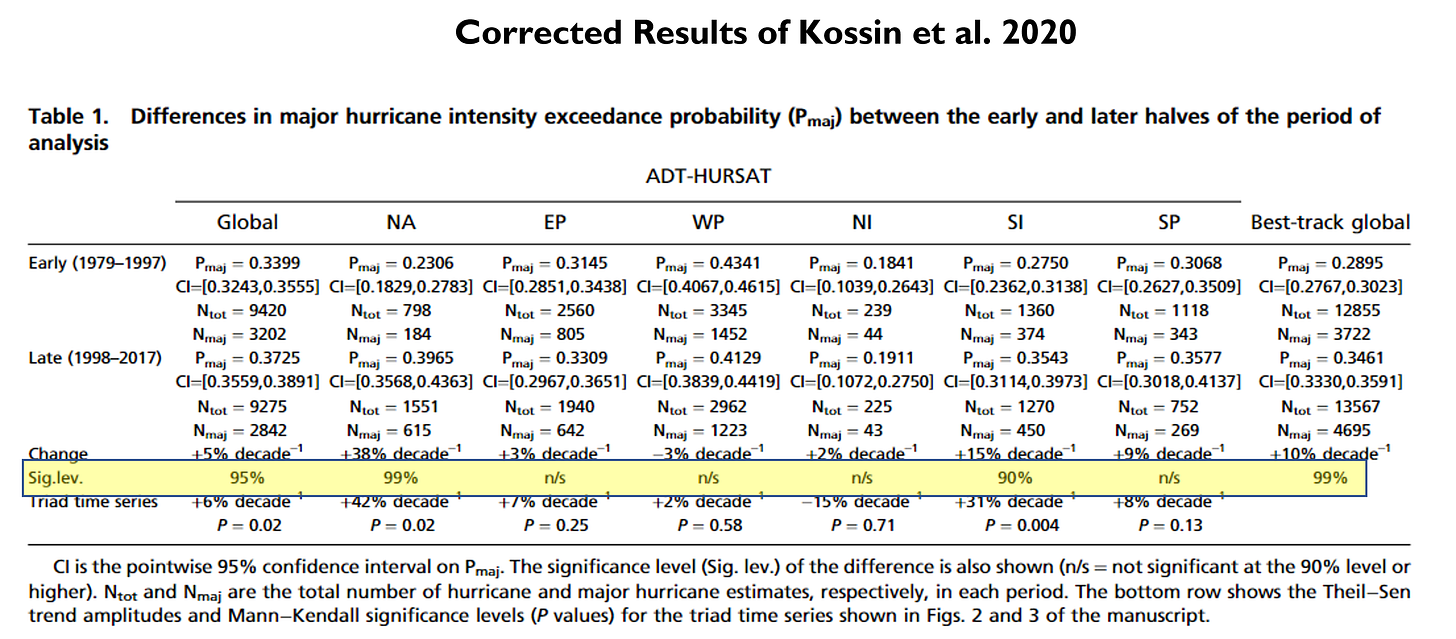
How massive? The trends that the original paper found to be of statistical significance across all of the world’s basins where tropical cyclones occur (officially 7, but condensed to 6 in Kossin et al. 2020) after the correction were only significant in just 2 basins — the North Atlantic and Southern Indian — representing less than 20% of all hurricane activity worldwide. So much for the global findings.
You can see the effects of the correction in the two images below, where I have highlighted in yellow the line referring to statistical significance of the findings for different regions: Global, NA= North Atlantic, EP = Eastern Pacific, WP = Western Pacific, NI = Northern Indian, SI = Southern Indian, SP = South Pacific. Spot the differences.
After the correction, Kossin et al. 2020 doesn’t even support what it originally claimed related to “fixes.” The IPCC was apparently unaware of the correction, and continued to promote its misinterpretation of Kossin et al. 2020 as one of the most important scientific results of the entire AR6 assessment cycle, layering unawareness of the literature on top of misinterpretation.
The IPCC oversight happened despite Kossin et al. submitting their correction in a very timely manner after the error was brought to their attention, and the correction appearing in press long before the IPCC deadline for inclusion in its SR. Were IPCC authors unaware of the correction? Aware of it but chose to ignore it? There are no good answers here.
It turns out that the IPCC did get things right on tropical cyclones, you just have to dig into the little noticed SROCC Chapter 6 to find it:
“The lack of confident climate change detection for most TC metrics continues to limit confidence in both future projections and in the attribution of past changes and TC events, since TC event attribution in most published studies is generally being inferred without support from a confident climate change detection of a long-term trend in TC activity.”
In the future, the IPCC might consider hitting me up. I seem to know this literature better than they do.
If you are still with me, thank you and congrats for sticking with it!
In part 2 of this discussion I will do some actual science and present what the data actually say on the occurrence of Category 3+ tropical cyclones as a proportion of all tropical cyclones of hurricane strength. I’ll show that the IPCC AR6 SR claim of detection and attribution is simply false.
References
Bouwer, L. M., & Wouter Botzen, W. J. (2011). How sensitive are US hurricane damages to climate? Comment on a paper by WD Nordhaus. Climate Change Economics, 2(01), 1–7.
Collins, D., & Lowe, S. P. (2001). A macro validation dataset for US hurricane models. Casualty Actuarial Society.
Grinsted, A., Ditlevsen, P., & Christensen, J. H. (2019). Normalized US hurricane damage estimates using area of total destruction, 1900− 2018. Proceedings of the National Academy of Sciences, 116(48), 23942-23946.
Klotzbach, P. J., Bowen, S. G., Pielke, R., & Bell, M. (2018). Continental US hurricane landfall frequency and associated damage: Observations and future risks. Bulletin of the American Meteorological Society, 99(7), 1359–1376.
Martinez, A. (2020). Improving normalized hurricane damages. Nature Sustainability, 3, 517–518.
Pielke, R. A., Gratz, J., Landsea, C. W., Collins, D., Saunders, M. A., & Musulin, R. (2008). Normalized hurricane damage in the United States: 1900–2005. Natural Hazards Review, 9(1), 29–42.
Pielke, R. A., & Landsea, C. W. (1998). Normalized hurricane damages in the United States: 1925–95. Weather and Forecasting, 13(3), 621–631.
Schmidt, S., Kemfert, C., & Höppe, P. (2009). Tropical cyclone losses in the USA and the impact of climate change – a trend analysis based on data from a new approach to adjusting storm losses. Environmental Impact Assessment Review, 29(6), 359–369.
Weinkle, J., Landsea, C., Collins, D., Musulin, R., Crompton, R. P., Klotzbach, P. J., & Pielke, R. (2018). Normalized hurricane damage in the continental United States 1900–2017. Nature Sustainability, 1(12), 808


Two comments.
First, the IPCC's style of argument, stressing quality and confidence, is a great advance on previous public scientific discourse, which always assumed the existence of a basis in scientific facts that are certain.
Second, there was a very important discussion of methodology in history, introduced in the trial involving David Irving, a prominent holocaust denier. Could this be relevant to policy-related science? The reference is: Thank Evans, by Allon Lee, in Australia/Israel Review, Sept.1 2007, https://aijac.org.au/.
"“There is a kind of interplay between the historian and the documents, which I think is the essence of writing history. If you simply go to history with a thesis and you look up the documents to try to prove it, then you are not really being a historian, you are being a propagandist because that will then involve you ignoring or trying to bypass the records. That’s why we have footnotes. We have to provide our critics with the means of disproving what we are saying."
I’ve been through a decent part of chapter 11 of AR6 (extreme weather). If there’s bad news it makes it to the summary. If there’s good news it doesn’t make it to the summary, or is obscured:
https://scienceofdoom.substack.com/p/summary-on-trends-in-tropical-cyclones
Long term decline in severe tropical cyclones - **good news** - doesn’t get a mention (caveat that we don’t have global data, but this doesn’t prevent bad news getting in where there isn’t global data). A 30-40 decline in accumulated cyclone energy - **good news** - makes it in as "intensifying tropical cyclones". See the article for details.
https://scienceofdoom.substack.com/p/summary-on-trends-in-extreme-rainfall
We don’t have data on global trends in floods - that doesn’t make it in. You’d think that would be important to stress.
We do have trends in heavy rainfall - up in some places, down in others, overall up - **bad news**. This makes it into the summary as "increasing heavy rainfall".
We do have trends in peak streamflow (think, risk of floods from rivers and waterways) - down in some places, up in others, overall down - ** good news**. This only makes it into the summary as "increasing in many places, decreasing in others". So no one learns about the good news unless they read the detail of the chapter.
The executive summary for chapter 11 says "Significant trends in peak streamflow have been observed in some regions over the past decades".
So, preliminary conclusion: safe pairs of hands are appointed to guide the flow of the report.