Just the Facts on Global Hurricanes
More storms? Fewer but more intense? More landfalls? No, No and No
Note: This post is co-authored with Ryan Maue, an absolutely top notch atmospheric scientist and data wrangler. Give him a follow on Twitter: @RyanMaue and check out his tropical activity tracking page.
Back in 2012, Jessica Weinkle (@Jessica Weinkle), Ryan Maue (@RyanMaue) and I published in the Journal of Climate the first peer-reviewed paper with a comprehensive dataset of global tropical cyclone landfalls. In 2019 we shared an updated version of the data at the request of the World Meteorological Organization (WMO) as part of their assessment of tropical cyclones and climate change. That WMO assessment was heavily relied on by the most recent assessment of the Intergovernmental Panel on Climate Change.
Today we share the most recent update, with data on global hurricane landfalls from 1970 to 2022 at the global level, and going back further in time for several of the most active locations for tropical cyclone activity. You won’t find these data anywhere else.
In our 2012 paper we discussed the detection of long-term trends in landfall:
“We have identified considerable interannual variability in the frequency of global hurricane landfalls; but within the resolution of the available data, our evidence does not support the presence of significant long-period global or individual basin linear trends for minor, major, or total hurricanes within the period(s) covered by the available quality data.”
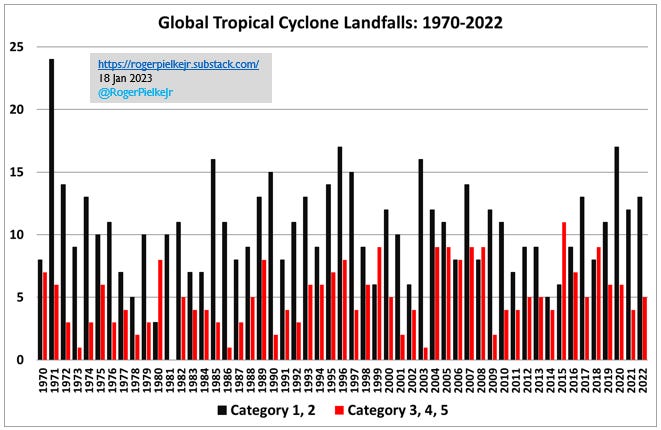
The figure below provides the latest update to Figure 2 of the original paper.

In 2022 there were 18 total landfalling tropical cyclones of at least hurricane strength around the world, of which 5 were major hurricanes. Since 1970 the median values are 16 total hurricanes, with 5 of major hurricane strength. So 2022 was very close to the median of the past half century.
Overall, based on IBTrACS best-track and preliminary data from Colorado State University since 1980, the overall number of hurricanes globally in 2022 was 86 (median = 87) and major hurricanes was 17 (median = 24). The figure below shows no long-term trends in hurricanes or major hurricanes.
If we look closely at the 12-month sums shown in the figure above we also see that the most recent 24 months has close to the least overall global activity of the past 40+ years, for both hurricanes and major hurricanes. This is not unexpected due to the ongoing triple-dip La Niña that tends to depress Pacific tropical cyclone activity while the Atlantic typically sees more frequent and intense hurricanes.
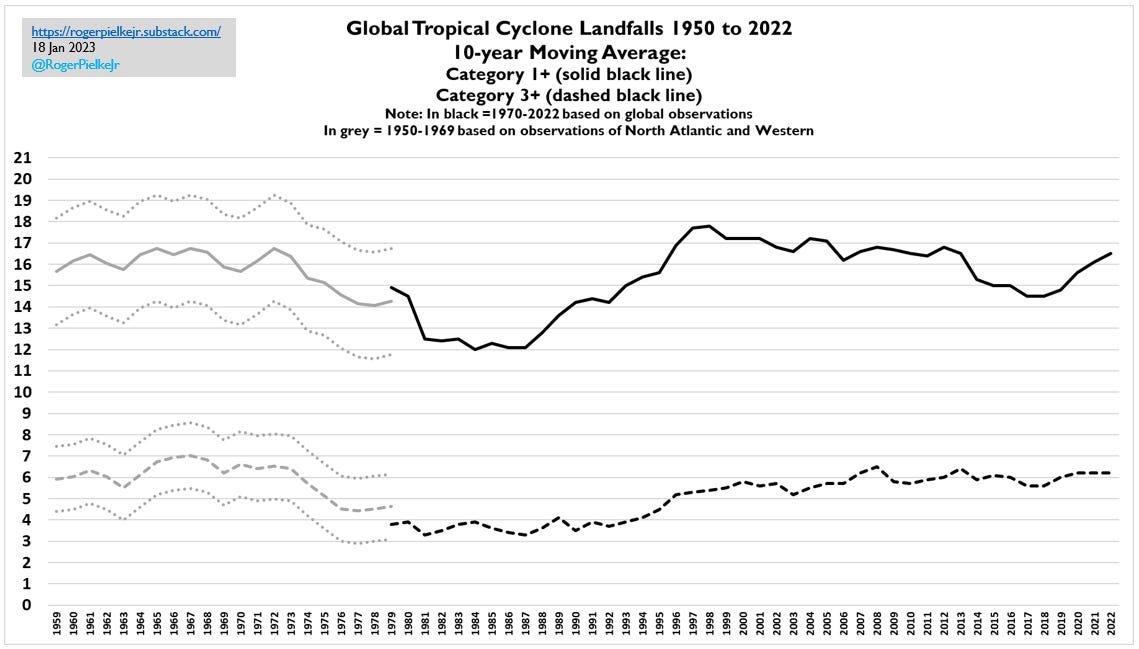
Our data also allow us to provide estimates of global landfalls going back further in time to 1950. The figure below sums:
(a) observations from 1950 from the Western North Pacific (WPAC, where aircraft reconnaissance of tropical cyclones has taken place since 1944) and North Atlantic, together representing >70% of global hurricane landfalls
and (b) an estimate of the landfalls from the rest of the world for 1950 to 1969 based on their statistics from 1970 to 2022.
The most striking feature of this figure is the pronounced dip in global landfalls in the 1970s and 1980s. If we look at just the landfalls in the WPAC and North Atlantic since 1945 there has been an overall sharp decline.
We have often urged caution in over-interpreting tropical cyclone time series that begin in the 1970s and 1980s because it is well understood that this period represented a low point in activity. Starting an analysis in that period invariably will result in upwards trends in tropical cyclone activity. But start the same analysis in the decades before, and those trends are muted or disappear altogether.
The most active tropical cyclone basins around the world are modulated by El Niño and La Niña on interannual time scales, but also interdecadal ocean oscillations like the Pacific Decadal Oscillation and Atlantic multidecadal variability. The Atlantic basin has generally been active since 1995, and how long this might last is uncertain.
If we look at the “accumulated cyclone energy” (ACE, an integrated value of frequency and intensity) of all global tropical cyclones of at least tropical storm strength, from the CSU dataset, we see no overall trend since 1980, as you can see in the figure below.
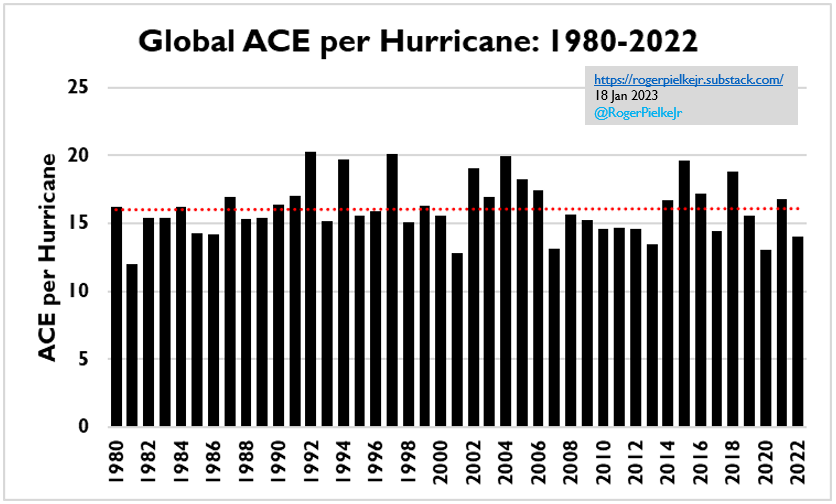
Importantly, when we look at global ACE per hurricane, we also see no trend, as you can see in the figure below. This means that hurricanes to date have not generally become more intense, although they may by later this century. However, as oceans warm, if all else is equal, the maximum potential intensity of hurricanes would increase, and as a result they will have greater precipitation. To date, observational evidence in support of theoretical expectations based on landfalling storms is mixed (see, e.g., here, here, here, here, here).
That we don’t presently see strong trends in tropical cyclones is not at all surprising. Research indicates that if climate models are accurate in their projections, we would not expect to be able to detect such trends for many decades or longer. One big reason for this is that tropical cyclones have a lot of variability in interannual and interdecadal time scales and projected changes in storm behavior are relatively much smaller. A common error in media coverage of hurricanes is to suggest that small trends possibly detectable later this century can be observed in the behavior of individual storms today.
In sum, over the past 70 plus years, landfalling hurricanes and major hurricanes have seen considerable multi-decadal and interannual variability, but there have not been pronounced trends. This is consistent with the current scientific consensus as reported in many IPCC and WMO reports.
For the North Atlantic (where the U.S. east and Gulf coasts are located), the National Oceanic and Atmospheric Administration has recently concluded:
“In summary, it is premature to conclude with high confidence that human-caused increases in greenhouse gases have caused a change in past Atlantic basin hurricane activity that is outside the range of natural variability, although greenhouse gases are strongly linked to global warming.”
At the global scale the most recent IPCC assessment concluded:
“There is low confidence in most reported long-term (multi-decadal to centennial) trends in tropical cyclone frequency- or intensity-based metrics.”
If you’d like to explore the dataset from our 2012 paper yourself, it can be downloaded here.
You won’t read these type of analyses anywhere else. Please share on social media and with friends and colleagues who might benefit from a reality-based perspective at the messy intersection of science, policy and politics. Comments are always welcomed, as are new subscribers at any level.


Superb, Roger and Ryan.
This recalls 2005, after Wilma. This was going to be new normal (2005 year). Then what happened?
If I have it right, 11 years + 10 mos consecutive without a cat 3 or higher hitting US coasts out of Atlantic basic as I recall.
If I'm not mistaken, that broke the old record for consecutive years in the basin without a "major", not by a month or a year but by about double (~6 years). Which had existed for around 100 years (since Galveston maybe?).
While the graphs don't seem to indicate this, I have to ask: is there any trend of increased volatility? As you may remember, last year I hypothesized that because CO2 generated in China or India might not reach the US for a year or so, this might imply greater variability in its effects even if the average stayed virtually the same. The analogy is to a glassmaking furnace in which there is great variability in composition until the tank becomes well-mixed.