How Could the IPCC Make an Error this Large?
Part 1: A major mistake with profound consequences for science and policy

Earlier this week I discussed the mystifying continued prioritization of the outdated and implausible RCP8.5 scenario by the Royal Netherlands Meteorological Institute (KNMI) in its scenarios expected to guide Dutch climate policies for the next decade. Since then I have heard from many friends and colleagues in the Netherlands offering a wide range of perspectives on what happened and what should happen next.
These exchanges have prompted me to summarize how the Intergovernmental Panel on Climate Change (IPCC) has treated climate scenarios in its most recent assessment reports. Today I document a major error made by the IPCC in its fifth assessment report (AR5) which has had profound consequences for climate research and policy in the decade since.
Settle in, this one is a doozy.
Let’s start with some brief background. All projections of future climate change, climate impacts and the costs and benefits of climate policies begin with scenarios of the future. Four RCP scenarios informed the IPCC’s AR5 (2013, 2014) and AR6 (2021, 2022) reports. An updated set of scenarios, seven SSPs, were also used in the AR6.1
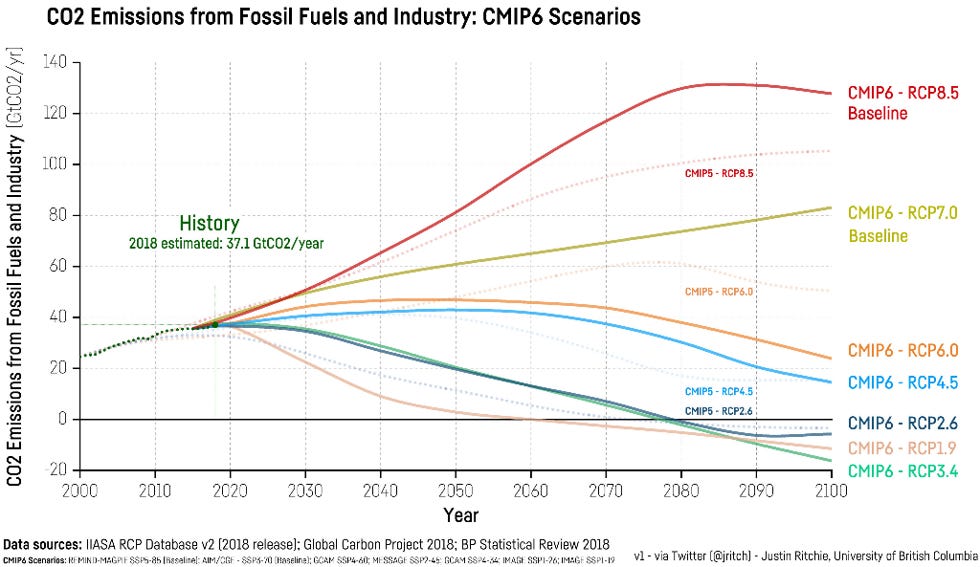
The figure below shows projected carbon dioxide emissions from the burning of fossil fuels to 2100 of the four RCPs (dashed lines) and seven SSPs (solid lines) from a figure created by my collaborator Justin Ritchie.
In order to project the future we need some sense of where-we-are-headed-if-we-don’t-change-course. In scenario-speak the jargon for where-we-are-headed-if-we-don’t-change-course includes baseline scenario, reference scenario and business as usual. These scenarios are designed represent a world without the adoption of further climate policies, which allows researchers to project alternative futures with various policy interventions, and then isolate the consequences of the interventions.
Scenario planning thus has potential to be incredibly useful. But it can also lead us badly astray if our foundational assumptions are incorrect. Mistakes in where we think we are headed or for how we think about the the consequences of intervention can obviously mislead and support decisions that do not lead to desired outcomes.
The IPCC AR6 explains that of the four original RCPs, first characterized in the literature in 2011, three of them were in fact expected to be used as baseline scenarios:
At the time the Representative Concentration Pathways (RCPs) were published, they included three scenarios that could represent emission developments in the absence of climate policy: RCP4.5, RCP6 and RCP8.5, described as, respectively, low, medium and high end scenarios in the absence of strong climate policy.
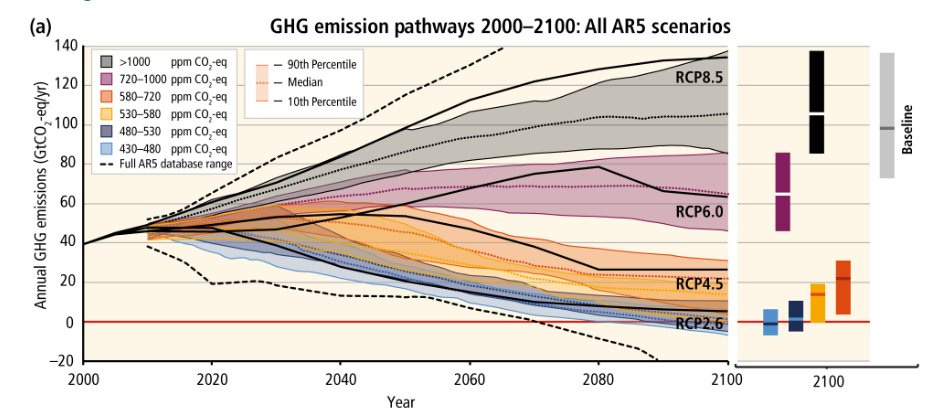
However — and here is where a major and consequential blunder was made by the IPCC — the IPCC AR5 in 2013 identified only RCP8.5 as a baseline scenario. You can see that in the IPCC figure below, which identifies the range of scenarios designated as baseline scenarios in the full AR5 database as compared to the four RCPs.
You can clearly see that the range of baseline scenarios depicted on the right side of the figure encompasses only RCP8.5, with RCPs 6.0, 4.5 and 2.6 falling below that range.
Although the creators of the four RCP scenarios intended that RCPs 4.5, 6.0 and 8.5 each serve as plausible baselines, the IPCC AR5 identified RCP8.5 as the only baseline of the four.2 Of course, researchers in the broader climate community who subsequently used scenarios in their research identified RCP8.5 as the baseline or business as usual scenario — of course they did, the IPCC said so!
Now have a look at what the IPCC AR6 says about using RCP8.5 as a business as usual scenario, emphasis added:
High-end scenarios (like RCP8.5) can be very useful to explore high-end risks of climate change but are not typical ‘business-as-usual’ projections and should therefore not be presented as such.
In 2013 the IPCC AR5 identified RCP8.5 as a reference scenario and less than a decade later the IPCC AR6 said that RCP8.5 should not be presented as business as usual. We should not be surprised that mass confusion has resulted. Here, for instance, are 10 examples from the IPCC AR6 where RCP8.5 was identified explicitly as a business as usual scenario.
The IPCC AR6 common use of and reference to of RCP8.5 (or SSP5-8.5) as a reference or business as usual despite the AR6 simultaneously saying not to do this is not surprising. After all, in 2013 the IPCC AR5 said RCP8.5 was the reference scenario and almost a decade of academic literature was produced under this assumption, meaning that the vast literature assessed by the IPCC AR6 was overrun by RCP8.5-as-baseline studies. Should the IPCC have simply ignored those studies?
It is a mess. In 2023, the IPCC should take note of Healy’s first law of holes.
These dynamics likely also help to explain why the IPCC AR6 offered a weak and mealy-mouthed defense of the continuing use of RCP8.5:
. . . the rapid development of renewable energy technologies and emerging climate policy have made it considerably less likely that emissions could end up as high as RCP8.5. This means that reaching emissions levels as high as RCP8.5 has become less likely. Still, high emissions cannot be ruled out for many reasons, including political factors and, for instance, higher than anticipated population and economic growth. Climate projections of RCP8.5 can also result from strong feedbacks of climate change on (natural) emission sources and high climate sensitivity (AR6 WGI Chapter 7). Therefore, their median climate impacts might also materialise while following a lower emission path (e.g., Hausfather and Betts 2020). All in all, this means that high-end scenarios have become considerably less likely since AR5 but cannot be ruled out.
It is worth pointing out that the reference to Hausfather and Betts 2020 in the excerpt above is to a blog post, not a peer-reviewed paper, which is contrary to IPCC guidance. Not surprisingly, in the Netherlands this week some of the official statements made by KNMI defending the use of RCP8.5 as a baseline echo the same unsupported assertions made by the IPCC in the passage above.
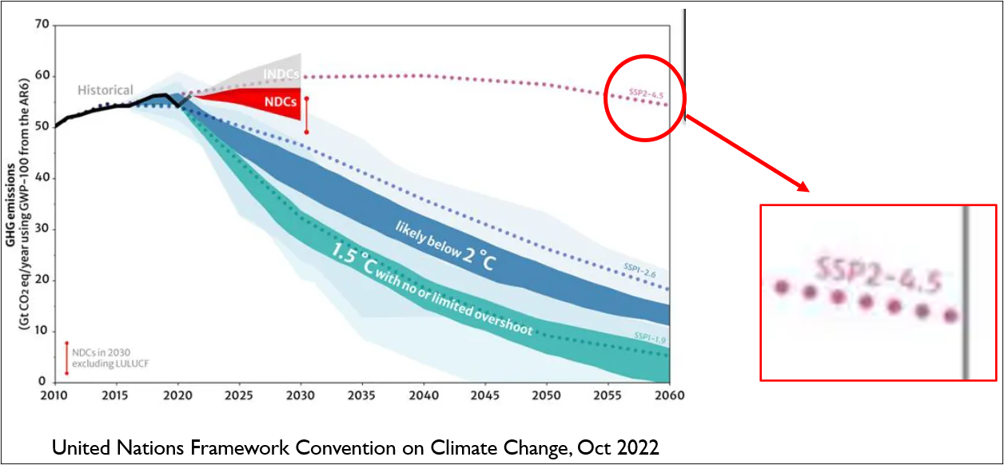
In the real world, there is today a broad consensus that a “current policies” emissions trajectory is tracking below RCP4.5 (look again at the figure at the top of this post), meaning the RCP4.5 is likely no longer an appropriate baseline. Rather little-used scenarios such as SSP2-3.4 might offer a more appropriate baseline in 2023.
Over the past decade, we have been badly mistaken in where-we-thought-we-were-headed. This is not because we should expect to be able to accurately predict the future — to the contrary, we erred because we ignored the fact that we cannot predict the future. That is why the RCP developers recommended using a wide range of baseline scenarios, spanning RCP4.5 to RCP8.5. Had we done so we would have included a baseline (RCP4.5) much closer to where we find ourselves today. Instead, we bet the farm on RCP8.5.
Imagine how different climate science and policy discussions would be if RCP4.5 was treated as a baseline scenario in research and assessment? As our view of future emissions has trended down, our collective view of climate would be profoundly different — less apocalyptic and more optimistic about costs and benefits of action.
Are scientists fearful of such a view? An official of KNMI was asked why the organization produced projections using RCP4.5 but refused to release them to the public. Here is his reply:
“We don't want people to take the intermediate scenario as a prediction from the KNMI”
Apparently interpreting RCP8.5 (or SSP5-8.5) as a prediction is OK.
As I have long argued, climate change is of course real and serious, and I am an advocate of decarbonization policies all the way to net zero. At the same time, the importance of climate policy does not mean that we can disregard scientific integrity or substitute science fictions for robust research.
KNMI had an opportunity to demonstrate scientific leadership this week by helping the climate community to reset expectations on scenarios to be more in line with the best available science. They have missed that opportunity, and have apparently locked in the misuse of RCP8.5 for another decade in the Netherlands.
Other opportunities will arise in other settings for the scientific community to show leadership by correcting course away from mistakes made over the past decade. The longer the climate community waits to correct course, the more uncertain the consequences for climate science, policy and politics.
For further reading:
Pielke Jr, R., & Ritchie, J. (2021). Distorting the view of our climate future: The misuse and abuse of climate pathways and scenarios. Energy Research & Social Science, 72, 101890.
Thanks for reading! Please like (heart button above), share (reStack above) and send to your friends and family. Honest brokering is a group effort and you are invited to join the THB community, at whatever level makes sense for you. All are welcome. So too are comments, critique and questions — especially on this post from scenario experts and those involved in the IPCC.
RCP = Representative Concentration Pathways; SSP = Shared Socioeconomic Pathways. For more detail on these scenarios, see my paper linked above. The RCPs were supposed to be a stopgap until the SSPs were developed but in practice the RCPs have dominated research and assessment and have never really been replaced by the SSPs.
No probability was assigned to the three plausible baselines, meaning that there has been no basis for selecting one to emphasize over the others. In other words, RCP4.5 should have always had the same stature as RCP8.5 as a baseline scenario.


How about, “it’s not an error” to start?
Or it’s not a bug it’s a feature.
At this point why would you label this an error, giving them an easy way out?
This is all purposeful, part of decision based evidence making.
Although I agree with you, Dr. Pielke, on almost everything you write in your excellent blog, I disagree with both the desirability and practicality of pushing for decarbonizing all the way to net zero. (I also question the assumption that warming will be net negative, but that's a different discussion.) In a post a few weeks ago, you provided a graph supposedly showing carbon-free sources at 18%. "That’s the highest it has been in my lifetime."
I've seen an argument that you are not including biomass, which accounts for more than all non-fossil sources, and that the number should be 7.5%, not 18% because you are using a source based on dubious "input-adjusted" rather than actual consumption numbers. I would be curious to read your thoughts in response. Details here:
https://wattsupwiththat.com/2023/07/03/the-myth-of-replacing-fossil-fuels/