How Climate Change Became Apocalyptic
Part 2: Digging deeper into the IPCC's most consequential error
Over the past 6 years I have spent a lot of time documenting and explaining how an implausible scenario of the future moved to the center of climate research and policy — our old friend RCP8.5. Today, RCP8.5 is so woven into the fabric of climate research, policy and advocacy that it has developed it own constituency among climate influencers who not only defend its continued use, but assert falsely that the scenario remains a plausible future.1
Today, I provide some additional background on errors made by the Intergovernmental Panel on Climate Change (IPCC) that led to the emphasis on RCP8.5.
Some readers have asked me whether these errors were mistakes or instead, tactical decisions to present climate change as more extreme than the evidence warranted. I have no evidence on the intent of IPCC participants. To be perfectly clear, I believe it unlikely that RCP8.5 was the result of tactical decisions — but I do have evidence of a hugely consequential scientific error made by the IPCC, one that continues to negatively influence research and policy.
Let’s take a closer look at how the cock up actually happened.
One aspect of the IPCC that is not widely appreciated — and is sometimes outright denied — is that the organization oversaw and directed the creation of the scenarios that underpin much of climate research. The IPCC thus served not simply as an assessor of the scientific literature, but also a coordinator and director of the research that it assesses.
The IPCC argued more than 15 years ago that its coordinating role in scenario development was a feature, as it “would probably lead to more homogeneity in the literature that is to be assessed later,” thus making the IPCC’s job of assessment much easier. After all, if everyone is using the exact same scenarios, then summarizing research results would be much easier.
The expectation of homogeneity was certainty fulfilled and it has indeed made assessment much easier — note the central role of IPCC scenarios, especially RCP8.5, in its reports. However, the expected feature turned out instead to be a huge flaw as it reduced research diversity, created a single point of failure, and concentrated climate research and applications in a misleading direction.
Here is the error — In the IPCC AR5, for whatever reason, the organization fundamentally mischaracterized the scenario literature, which elevated RCP8.5 and eliminated other baseline scenarios that were far less extreme. Whether you today believe RCP8.5 to be plausible or not is completely independent from the error documented below, which is obvious and undeniable.
Let’s take a quick trip back in time to document exactly how this happened.
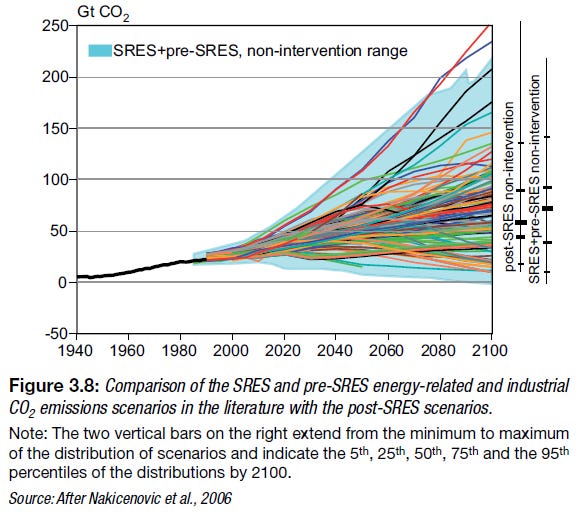
In 2000, the IPCC presented its SRES Scenarios, which were a set of baseline scenarios designed to project where we thought the world might be headed in the long-term future. They were apportioned into four scenario families and designated as A1, A2, B1, B2 and no likelihoods or probabilities were associated with any of the families or individual scenarios.2
You can see the carbon dioxide emissions trajectories of these scenarios in the figure below. I added the CO2 range on the vertical axis in red and sketched in the 10% and 90% scenario range with the blue lines, which will be important in the discussion below. For 2100 this range spanned ~25 gigatons (Gt) CO2 to ~130GtCO2.3
The SRES Scenarios were controversial for a number of reasons, including that they were all baseline scenarios and also because they projected some very low carbon futures in the absence of climate policy, which climate advocates strongly objected to. Calls for new scenarios came immediately.
In 2006, the IPCC requested that its task group on scenarios develop an updated set of scenarios that spanned the “full range” of scenarios found in the literature:4
“benchmark concentration scenarios should be compatible with the full range of stabilization, mitigation and baseline emission scenarios available in the current scientific literature”
The new scenarios were to be informed by the work of the IPCC’s Fourth Assessment Report (AR4 in 2007) which surveyed the literature on scenarios that had been published since the SRES scenarios. These newer scenarios were called post-SRES scenarios. The AR4 concluded of the new scenarios:
[T]he scenario range has remained almost the same since the SRES. There seems to have been an upwards shift on the high and low end, but careful consideration of the data shows that this is caused by only very few scenarios and the change is therefore not significant. The median of the recent scenario distribution has shifted downwards slightly, from 75 GtCO2 by 2100 (pre-SRES and SRES) to about 60 GtCO2 (post SRES).
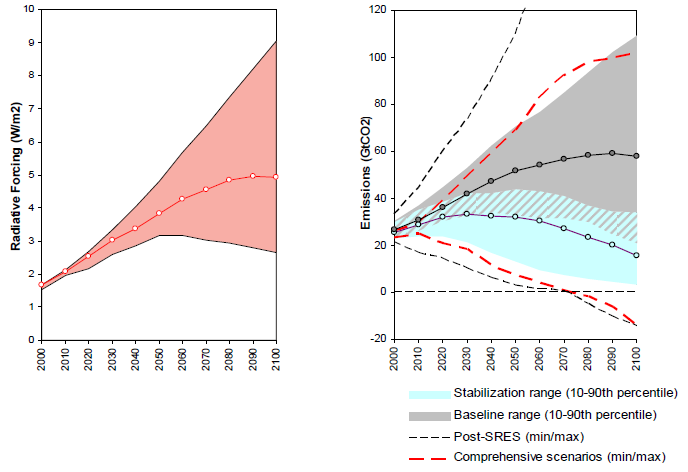
With this information, the IPCC group charged with developing new scenarios to underly work to be assessed in the IPCC Fifth Assessment (AR5 in 2013 and 2014), held a workshop in the Netherlands in September 2007. When published, that report included the following figure, showing the range of emissions associated with the post-SRES scenarios, and indicating baseline scenarios and policy scenarios in blue, as well as their overlap in the hatched region.
You can see that the baseline range spanned from ~20 GtCO2 to ~100 GtCO2, with a median a bit less than 60 GtCO2. As we would expect, these values were just about the same as those reported in the 2007 AR4 report.
The workshop report recommended four scenarios that would later become known as the RCPs. You can see those four scenarios, with their original names in the figure below.
You can clearly see that the baseline range is fully bracketed by MES-AR2 8.5 (RCP8.5) and MiniCAM 4.5 (RCP4.5). This is consistent with the request of the IPCC leadership for new scenarios that encompassed the “full range” of baseline scenarios in the literature. It is also how the creators of the new scenarios later introduced them to the world — RCPs 4.5, 6.0 and 8.5 were to be considered low, medium and high baselines, as you can see from the table below.
Here is where things went wrong.
When the RCPs were characterized in the AR5 reports in 2013 and 2014, RCP6.0 and RCP4.5 had been transformed from baseline scenarios to policy scenarios, and RCP8.5 remained as the only baseline scenario. You can see this in the figure below, which I have annotated to make clear what happened.
The AR5 range for scenario baselines — bracketed by the red lines in the figure above— spanned ~50 GtCO2 to ~105 GtCO2 (denoted as 10th and 90th percentiles in the left panel above). Baselines below 50 GtCO2 which you can see in the right panel from the 2007 IPCC workshop simply disappeared.
Today, on “current policies” trajectories the world is projected to be well below 50 GtCO2 in 2100, much lower in fact, so those more realistic baselines sure would have been useful had they been used in research over the past decade.
What happened? Where did these far more realistic baselines go?
I don’t have a complete answer to these questions. I have downloaded the baseline scenario data from the AR5 Database, and confirmed the numbers in the left panel above. For whatever reason, the criteria used by the IPCC Working Group 3 to for including scenarios in the AR5 database had the consequence of eliminating (or perhaps recharacterizing not as baselines) the lower post-SRES baselines previously identified by the IPCC.
I invite participants in the AR5 and in the development of the RCPs to explain how this major error occurred.
I see no evidence to support assertions that there was anything calculated or nefarious going on back in the AR5. However, in 2023 the continued support of RCP8.5 in the face of overwhelming and undeniable evidence that it is out-of-date, certainly does have a political element. For instance, a spokesperson of the Dutch KNMI stated on Twitter that critiques of RCP8.5 are motivated by opposition to climate policy.
The consequences of the IPCC designating RCP8.5 as the only legitimate baseline scenario of those made available to researchers has been consequential.
There are tens of thousands of scholarly papers that use RCP8.5 as a baseline and RCP4.5 or RCP2.6 as policy success and today have no practical value.
The recent IPCC AR6 report is centered on RCP8.5 and similarly has dubious practical value.
RCP8.5 results have been widely promoted in the media and by climate influencers to characterize climate change in apocalyptic terms.
Governments have widely adopted RCP8.5 as a policy baseline for adaptation planning.
RCP8.5 is widely used to characterize the costs and benefits of mitigation, both of which are subsequently exaggerated.
A cottage industry of “climate analytics” has sprung up, creating predictions, forecasts and projections of the future based on RCP8.5 as a baseline. Caveat emptor.
RCP8.5 has become a political object with benefits to those seeking to alarm and also to those pointing to flawed science in climate research. Because of these dual benefits, expect the politicization of RCP8.5 to intensify.
I will soon share some ideas for alternative ways that we might collectively move beyond RCP8.5 and its tight grip on the community.
A good first step would be for leaders in the scientific community to acknowledge the major error made by the IPCC AR5 that transformed RCP8.5 into the only legitimate baseline scenario and eliminated the more realistic ones. We need to understand how the mistake happened in the world’s preeminent science assessment and take steps to ensure that a mistake of this magnitude cannot happen again.
Read more on the debacle that is RCP8.5, much more (and please subscribe to THB)
Pielke Jr, R., & Ritchie, J. (2021). Distorting the view of our climate future: The misuse and abuse of climate pathways and scenarios. Energy Research & Social Science, 72, 101890.
It has been common among those still holding tightly to RCP8.5 to now characterize it as a “worst case” — that is wrong also. More on that in a future post.
The fossil fuel-intensive SRES A2 marker scenario is the parent scenario of RCP8.5. Few appreciate that RCP8.5 is actually MESSAGE SRES A2r, with origins in the 1990s. Of course it is out of date.
Groups of scenarios should not be treated as statistical distributions, which the community well knows and often violates.
The term ”benchmark concentration scenario” was soon replaced with “representative concentration pathway” or RCP.


RCP8.5 in urban forestry policy:
I am currently at the World Forum on Urban Forests where a talk is scheduled to be presented (I have heard it before) that makes recommendations for "tree species for the future." Their model uses RCP8.5 to *predict* future temperatures in California cities, then makes tree species recommendations assuming that this new climate will appear. When I first heard this work presented, I questioned their choice of RCP8.5 and was told, with condescension, that this is the scenario we can expect to happen if changes aren't made.
When I pointed out that RCP8.5 was barely possible, let alone plausible enough to base important decisions on, they nearly rolled their eyes, but suggested that they might possibly conduct a sensitivity analysis to see how important the choice of scenario is.
One fundamental problem with RCP8.5 is that it is based on a population of 12 billion in 2100. Current estimates are that the Earth will have no larger than the 2023 population of 8 billion and would be lower if the fertility rates continue to drop.