Disasters Cost More Than Ever — But Not Because of Climate Change
From the archives, a look back and an update

This week marks my final spring break as a professor at the University of Colorado Boulder. Ten years ago this week, during spring break while on vacation with my family, I was dealing with the consequences of what appeared to be an online mob seeking to get me fired from Nate Silver’s 538 where I had just been hired as a writer.
My first piece for 538 was a summary of recent IPCC report consensus conclusions on disasters and extreme events. The apparent mobbing worked.1 I soon lost my position as a writer at 538.
Not long after, I was under investigation by a member of Congress.2 I lost the support of my university and my role in the center I had founded, so I moved across campus to work on sports governance.3 I have little doubt that I remained employed only thanks to academic tenure. It was quite an experience.
Two years later, in 2016, courtesy of the Wikileaks publication of John Podesta’s emails, it was revealed that the Center for American Progress, funded by billionaire Tom Steyer and in collaboration with the ever-present Michael Mann, had been engaged in a well-funded campaign to delegitimize my research, hurt my career, and to have me removed as a writer at 538.4
I can draw a straight line from those events a decade ago to where I am today. And given where I am today, I wouldn’t change a thing. I have no hard feelings towards Nate — He got played and did what he felt he had to at the time.
Below, I have reproduced my first column at 538 in 2014 that was apparently so threatening to some in the climate advocacy community.5 I also add a post-script below. How does it hold up?
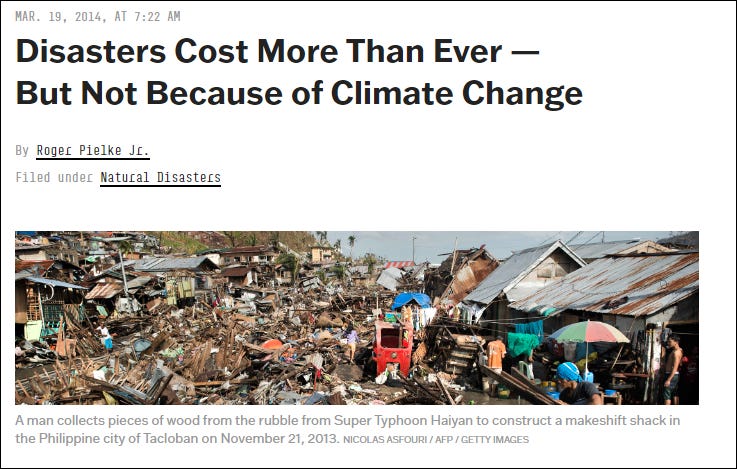
In the 1980s, the average annual cost of natural disasters worldwide was $50 billion. In 2012, Superstorm Sandy met that mark in two days. As it tore through New York and New Jersey on its journey up the east coast, Sandy became the second-most expensive hurricane in American history, causing in a few hours what just a generation ago would have been a year’s worth of disaster damage.
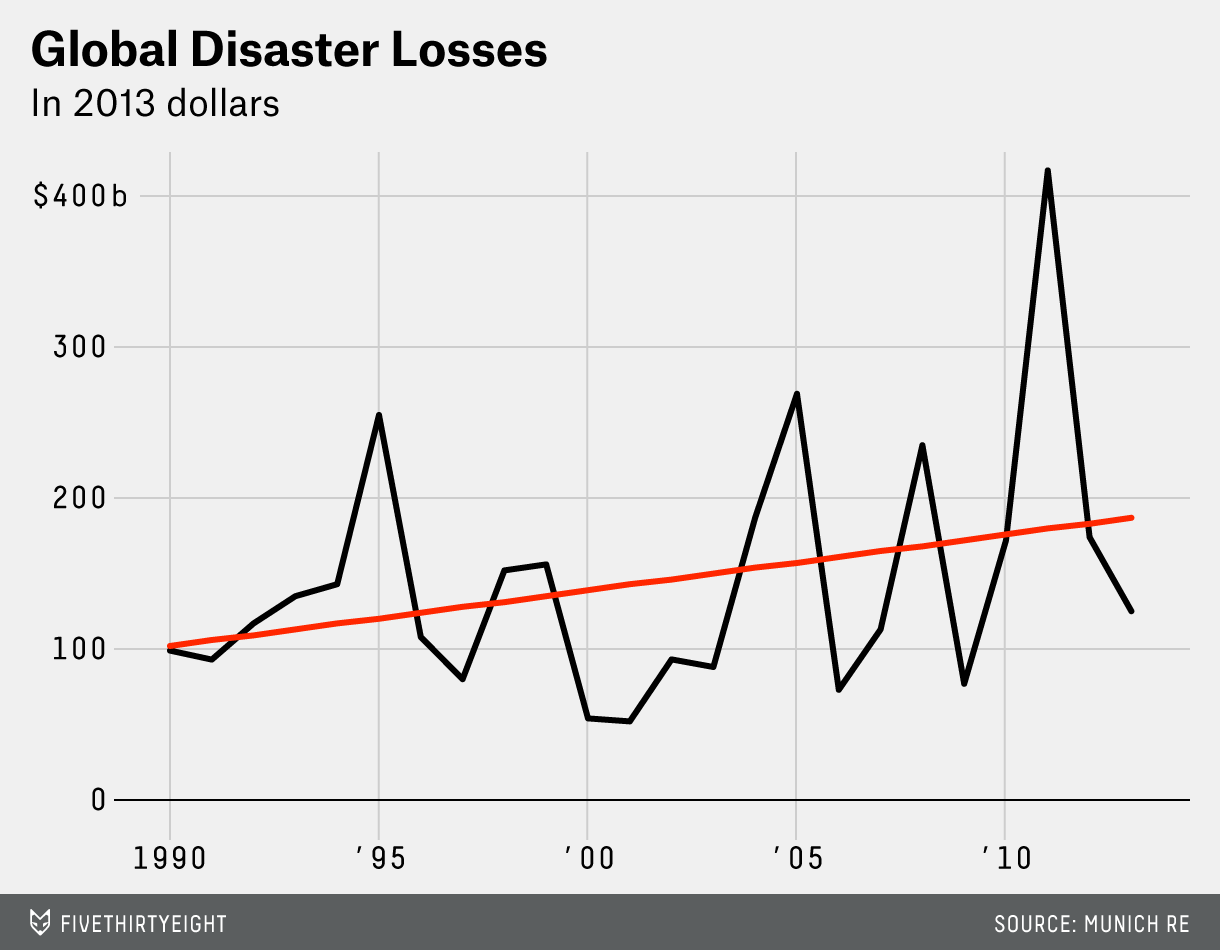
Sandy’s huge price tag fit a trend: Natural disasters are costing more and more money. See the graph below, which shows the global tally of disaster expenses for the past 24 years. It’s courtesy of Munich Re, one of the world’s largest reinsurance companies, which maintains a widely used global loss data set. (All costs are adjusted for inflation.)
In the last two decades, natural disaster costs worldwide went from about $100 billion per year to almost twice that amount. That’s a huge problem, right? Indicative of more frequent disasters punishing communities worldwide? Perhaps the effects of climate change? Those are the questions that Congress, the World Bank and, of course, the media are asking. But all those questions have the same answer: no.
When you read that the cost of disasters is increasing, it’s tempting to think that it must be because more storms are happening. They’re not. All the apocalyptic “climate porn” in your Facebook feed is solely a function of perception. In reality, the numbers reflect more damage from catastrophes because the world is getting wealthier. We’re seeing ever-larger losses simply because we have more to lose — when an earthquake or flood occurs, more stuff gets damaged. And no matter what President Obama and British Prime Minister David Cameron say, recent costly disasters are not part of a trend driven by climate change. The data available so far strongly shows they’re just evidence of human vulnerability in the face of periodic extremes.
To identify changes in extreme weather, it’s best to look at the statistics of extreme weather. Fortunately, scientists have invested a lot of effort into looking at data on extreme weather events, and recently summarized their findings in a major United Nations climate report, the fifth in a series dating back to 1990. That report concluded that there’s little evidence of a spike in the frequency or intensity of floods, droughts, hurricanes and tornadoes. There have been more heat waves and intense precipitation, but these phenomena are not significant drivers of disaster costs. In fact, today’s climate models suggest that future changes in extremes that cause the most damage won’t be detectable in the statistics of weather (or damage) for many decades.
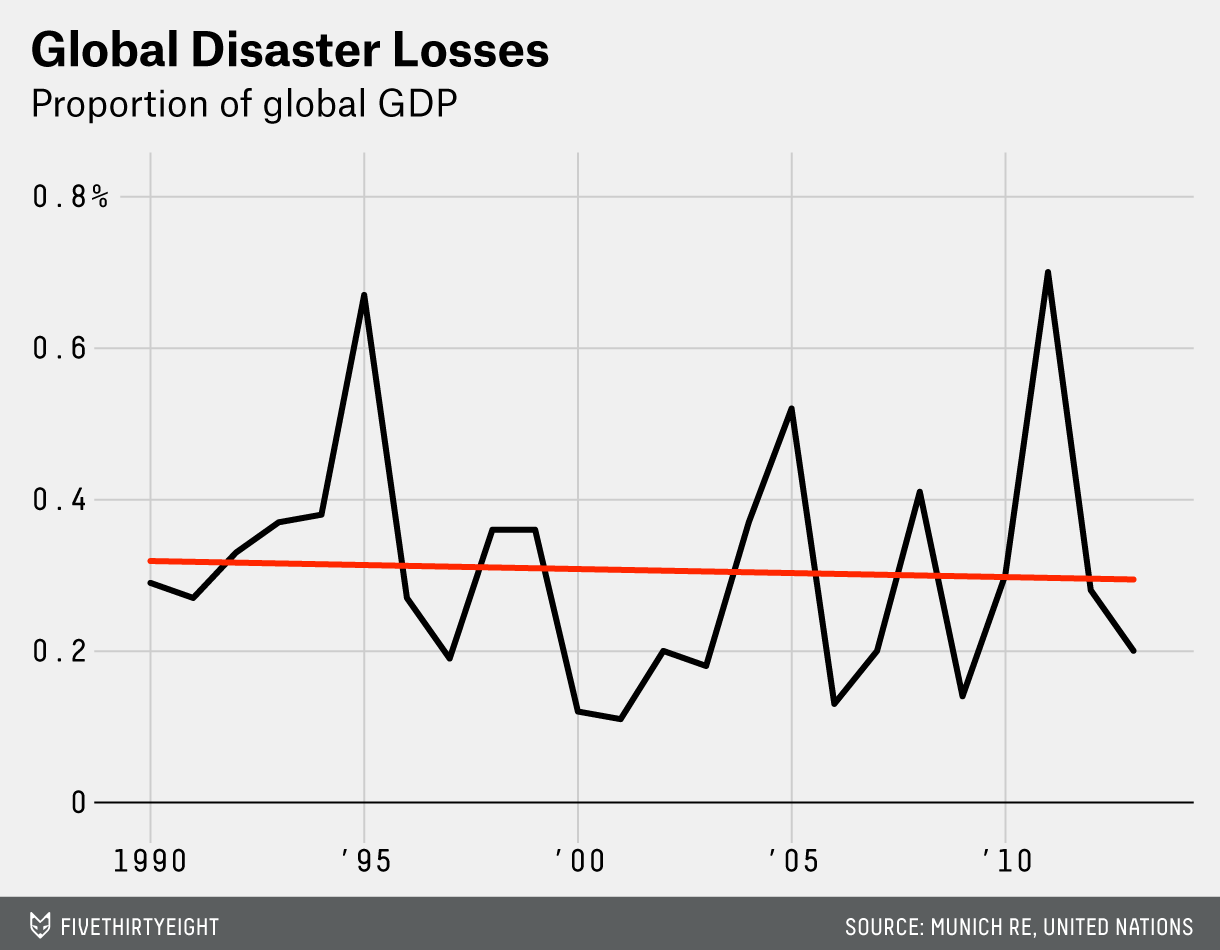
On Earth, extreme events don’t happen in a vacuum. Their costs are rising, sure, but so is overall wealth. When we take that graph above and measure disaster cost relative to global GDP, it changes quite a bit.6
Occasionally, big disasters bring outsize costs — especially the Kobe earthquake in 1995, Hurricane Katrina in 2005 and the Honshu earthquake in 2011 — but the overall trend in disaster costs proportional to GDP since 1990 has stayed fairly level. Of course, wealthy countries hold all of the sway in worldwide cost estimates, which tips the scales when we’re looking for a “global” perspective on extreme events. U.S. hurricanes, for example, are responsible for 58 percent of the increase in the property losses in the Munich Re global dataset.
That’s just the property bill. There’s a human toll, too, and the data show an inverse relationship between lives lost and property damage: Modern disasters bring the greatest loss of life in places with the lowest property damage, and the most property damage where there’s the lowest loss of life. Consider that since 1940 in the United States 3,322 people have died in 118 hurricanes that made landfall. Last year in a poor region of the Philippines, a single storm, Typhoon Hayain, killed twice as many people.
We can start to estimate how countries may weather crises differently thanks to a 2005 analysis of historical data on global disasters. That study estimated that a nation with a $2,000 per capita average GDP — about that of Honduras — should expect more than five times the number of disaster deaths as a country like Russia, with a $14,000 per capita average GDP.2 (For comparison, the U.S. has a per capita GDP of about $52,000.)
In the 20th century, the human toll of disasters decreased dramatically, with a 92 percent reduction in deaths from the 1930s to the 2000s worldwide. Yet when the Boxing Day Tsunami struck Southeast Asia in 2004, more than 225,000 people died.
So the frequency of disasters still matters, and especially in countries that are ill-prepared for them. After 41 people died in two volcanic eruptions in Indonesia last month, a government official explained the high stakes: “We have 100 million people living in places that are prone to disasters, including volcanoes, earthquakes and floods. It’s a big challenge for the local and central governments.”
When you next hear someone tell you that worthy and useful efforts to mitigate climate change will lead to fewer natural disasters, remember these numbers and instead focus on what we can control. There is some good news to be found in the ever-mounting toll of disaster losses. As countries become richer, they are better able to deal with disasters — meaning more people are protected and fewer lose their lives. Increased property losses, it turns out, are a price worth paying.
Postscript March 2024
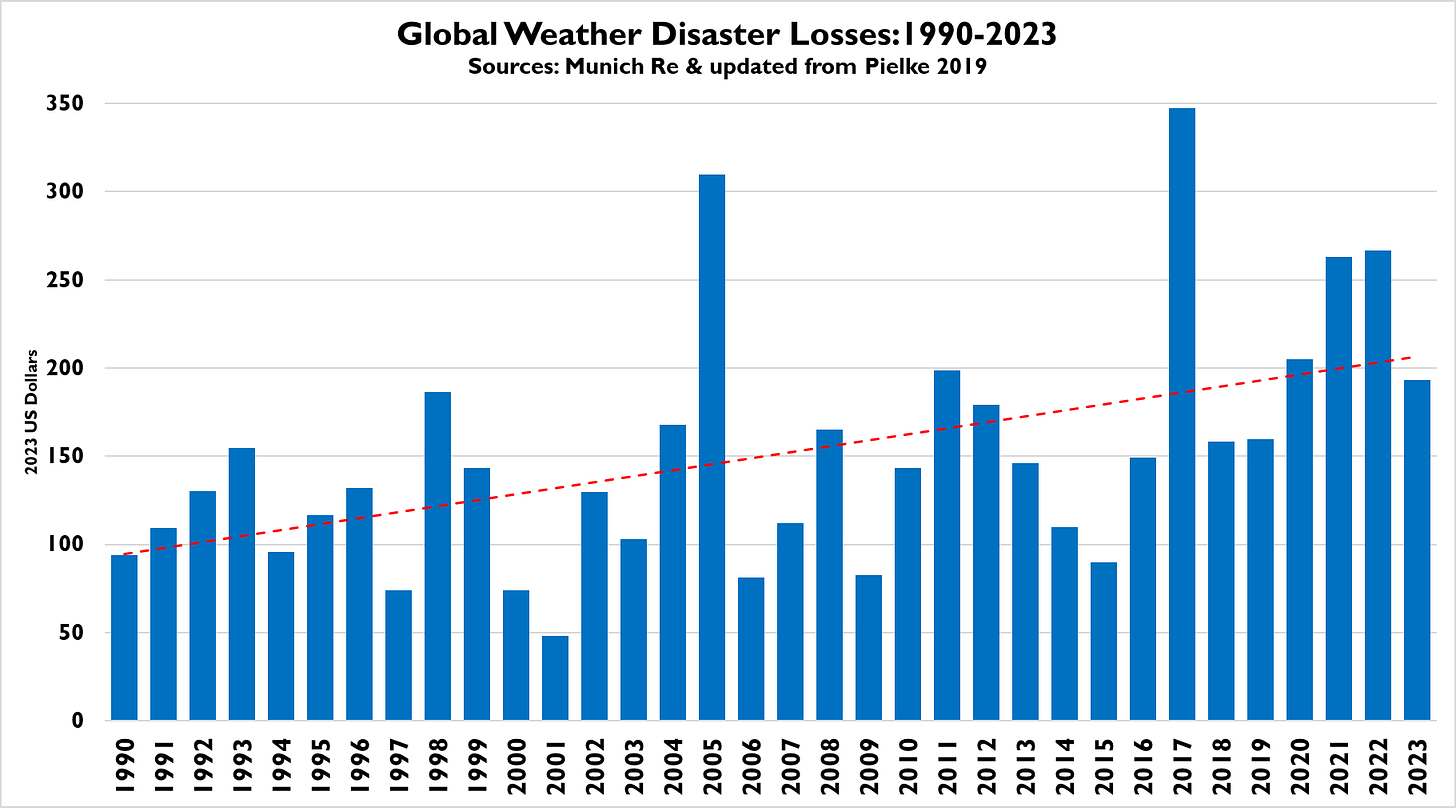
As THB readers well know, I have continued the research that was the subject of the column above. Below is an update to the figures in the column above, adjusted just for inflation and with 11 more years of data.
Below is the second figure showing weather and climate disaster losses as a proportion of global GDP.
I’ve published this analysis in the peer-reviewed literature as well:
Pielke, R. (2019). Tracking progress on the economic costs of disasters under the indicators of the sustainable development goals. Environmental Hazards, 18(1), 1-6.
Thanks for reading! Comments welcomed. I’m on spring break, see you next week.
I say “apparent mobbing” because it was by all indications a bot-driven campaign. If you search X/Twitter today, no evidence of the campaign remains.
The congressman accused me of receiving undisclosed money from Exxon due to his disagreement with congresisonal testimony I had given summarizing my peer-reviewed research and the consensus reports of the IPCC. My university investigated me at his request, but by the time it reported back to the congressman, he had moved on and taken down his request letter, which he had posted online. Apparently, the congressman’s purpose was simply to announce an investigation and have it widely reported — which it was. Politics ain’t beanbag.
This turned out to be fortuitous, as my sports governance work has been enormously rewarding, allowing me to do rewarding research and develop new and wonderful colleagues around the world. It continues today.
By 2014 I had been under constant attack by CAP and its climate point man, Joe Romm for years. At one point I documented more than 160 articles that they had written about me by 7 different authors (including Matt Yglesias and Emily Aitkin who are both now successful on Substack), at one point at a rate of more than one article per week. That was weird. The 2016 revelation of a well-funded campaign against me was eye-opening but not surprising.
It wasn’t just the essay — I and sure that it was also the idea that I would have a very prominent platform. For some people it was personal.
This data is again from the global data set maintained by Munich Re, and the GDP data comes from the United Nations.


Thank you for being steadfast and standing up for reality despite the ordeal that the dogmatists and climate cuckoos have put you through. It’s why I subscribe to, and enjoy, your Substack. I just wish there was some mechanism for repercussions to the likes of Mann, Podesta, Steyer, and the countless others of their ilk, beyond the general mistrust of institutions and the so-called “elites” running them. The damage these imbeciles inflict upon science is real and hurts us all.
Hi Roger,
Did Munich Re start with 1990? And if they did, is there someone who did analyses that goes back to the 1980s and 1970s that could be added?