Billion Dollar Disasters on Steroids
NOAA's hidden archive and the problematic methods it reveals
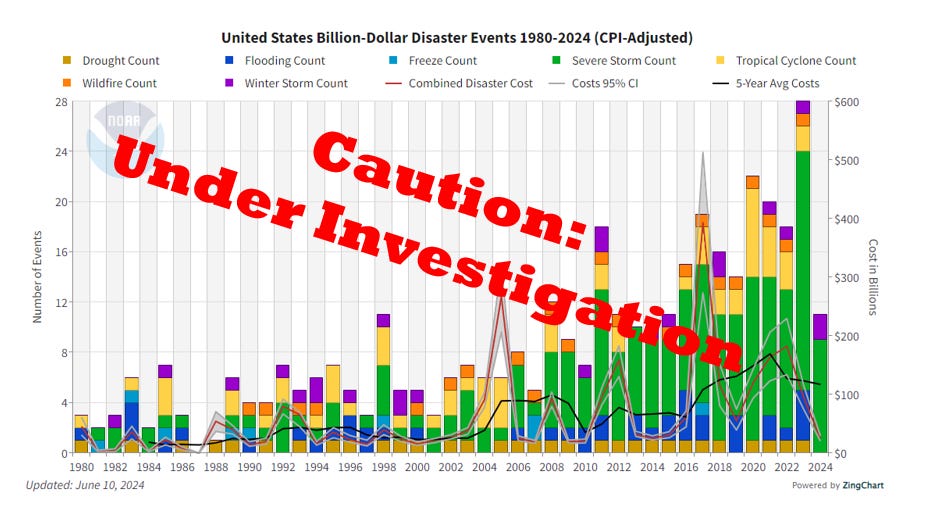
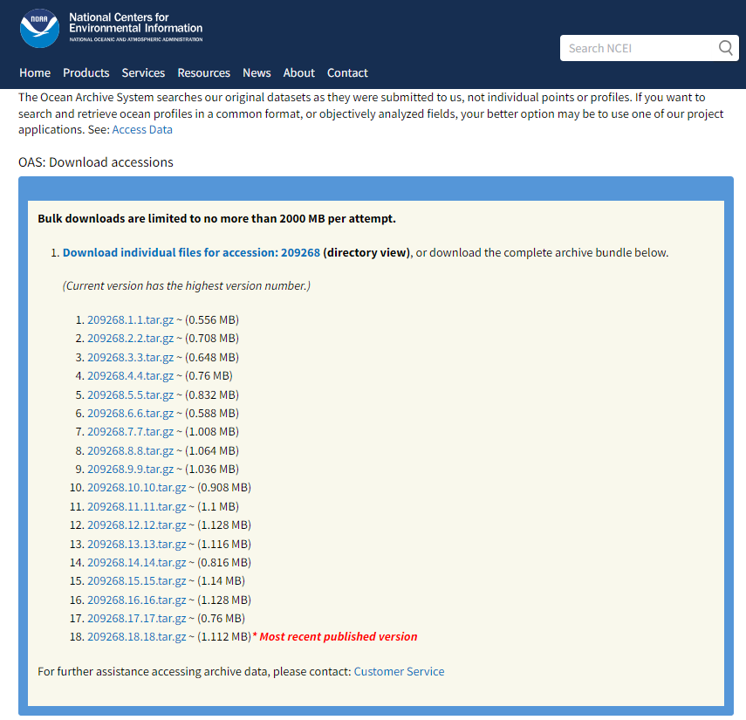
Shortly after my paper Scientific integrity and U.S. “Billion Dollar Disasters” was accepted for publication, I was tipped off to a public but unnamed and well-hidden directory on the website of the National Oceanic and Atmospheric Administration (NOAA) that contained 17 (now 18) of the most recent versions of the “billion dollar disaster” (BDD) tabulation, dating to March 2020.
Today, I reveal the archive and what it tells us about the problematic methods underlying NOAA’s billion dollar disaster tabulation.
First, some brief background — Last January, upon submitting my paper for publication, in parallel I submitted a formal request to NOAA asking for a “correction,” based on my paper’s conclusions that NOAA had failed to follow its own Information Quality and Scientific Integrity policies.
NOAA first told me they would respond to my request by mid-May, then later told me that it would be mid-June, and then last week they said a response would come mid-July. I take that as a positive sign that NOAA is taking this issue seriously and needs more time to address the issues that I raise in my paper. I had planned to write this post in mid-June with NOAA’s response in hand, but discussing NOAA’s response will have to wait.
In the absence of methodological transparency, the hidden archive of the most recent 18 versions of NOAA’s “billion dollar disasters” allows an unprecedented opportunity to reverse-engineer NOAA’s methods that the agency employs for creating and updating its widely cited and highly influential tabulation.1 As you will see below, what the 18 versions reveal is highly concerning.
I document in my recent paper that NOAA releases neither its methodology nor the input data that underlies the various iterations of the BDD tally — only the final tabulation, and even then NOAA does not document changes to loss estimates between versions or maintain a public archive of previous tabulations.
In recent weeks, as I have been analyzing the 18 versions of the hidden directory, I contacted NOAA’s National Center for Environmental Information (NCEI) with a few very basic questions about their data.
In response, NOAA/NCEI refused to share any methodological details or data, telling me curtly:
“Much of the core asset level data are from private sector data sources and proprietary in nature, which cannot be shared.”
NOAA/NCEI did not respond to further inquiries.
With this post I report some of my initial findings after looking carefully at the 18 most recent versions of the BDD tabulation.2
It is clear that NOAA is risking a significant science scandal — simply because the agency has implemented flawed methodological choices with the resulting effect, in each instance, of artificially boosting counts of billion-dollar disasters, and there is no methodological or data transparency that would allow NOAA to justify these choices.3
We should of course expect disaster losses to increase over time due to population growth and increasing wealth and development — however the methodological choices revealed by the hidden NOAA archive indicate improper increases in recent estimated disaster losses and disaster counts independent of any of these factors, which NOAA acknowledges that it does not consider.
The juicing of the counts of billion dollar disasters matters not because the tabulation is of significant scientific importance — it is not — but because NOAA has promoted the tabulation so heavily as being scientifically important. The list of disaster counts has also variously been adopted as a scientifically-meaningful dataset by the U.S. National Climate Assessment, the U.S. president, in the peer-reviewed scientific literature, across the major media, and by decision makers in many public and private sector settings.
The hidden archive reveals that NOAA has improperly inflated trends in the counts of billion dollar disasters. I won’t speculate on why NOAA — one of the nation’s preeminent scientific agencies, full of smart and thoughtful people — has taken this route, but I do hope that the ongoing investigation ensures that this sort of thing can not happen again. I have a lot of confidence in the scientists in NOAA.4
Below, I discuss four methodological issues revealed by the hidden archive:5
The recent increase in mini-disasters,
Inflation adjustments that increase loss estimates for recent disasters more than for historical disasters,
Additions of historical disasters using unknown methods that depart from NOAA’s described methods,
Events with loss totals that cannot be replicated using public or private information.
Let’s consider each in turn.
Many Mini-Disasters

One of the problems with maintaining a time series of “billion dollar disasters” is that the meaning of a billion dollars changes over time. The right panel in the figure above shows that $1 billion in 2024 equates to about $260 million in 1980, when the BDD tally starts, based on the CPI Index used by NOAA. Similarly, the left panel above shows that $1 billion in 1980 equates to about $3.8 billion in 2024.
In my paper, I document the recent rapid and puzzling increase in disasters with estimated losses of $1 billion to $2 billion. Since 2020, across the 18 versions, NOAA has added 91 disasters to the tally — 61 are new events and 30 are from before 2020 (and discussed in detail below).
Of these 91, there are 55 — more than 60% — that would not have met the $1 billion threshold in the 1980s or 1990s, simply due to CPI adjustments. That means that the overall trend would be cut by about in half if the billion dollar threshold applied for inclusion were inflated to its 2024 value.
The inclusion of many recent mini-disasters that would not have appeared in the 1980s or 1990s boosts the recent count of billion dollar disasters.
Inflation Adjustments Affects Recent Disasters More than Past Disasters
In principle, a CPI adjustment for inflation should apply equally to each disaster. For instance, if inflation from last year to this year is 3% then a 3% adjustment should apply equally to the inflating of each disaster’s estimated losses, whether that disaster occurred in 1981 or 2021.
NOAA does not apply an equal application of CPI adjustments to all events across the different versions.6
Specifically, across the 18 versions — from March 2020 to April 2024 — the average inflation increase in losses for disasters of 1980 to 1989 was about 18%, but for disasters from the most recent decade — 2014 to 2023 — it was more than 26%.7
Because NOAA does not provide details on its methods it is impossible to know why the inflation adjustment is differentially applied, and why that application is a function of the recency of the disaster.
What we can say with certainty is that the result of the adjustment protocol is to make more recent events increase in losses faster that those of the past, again with the effect of boosting recent counts of billion dollar disasters.
Additions of Past Disasters is Arbitrary
NOAA claims:
“[W]e introduce events into the time series as they "inflate" their way above $1B in costs in today's dollars. Every year, this leads to the introduction of several new events added from earlier in the time series.”
The hidden archive’s 18 different tabulations show undeniably that this claim is false.
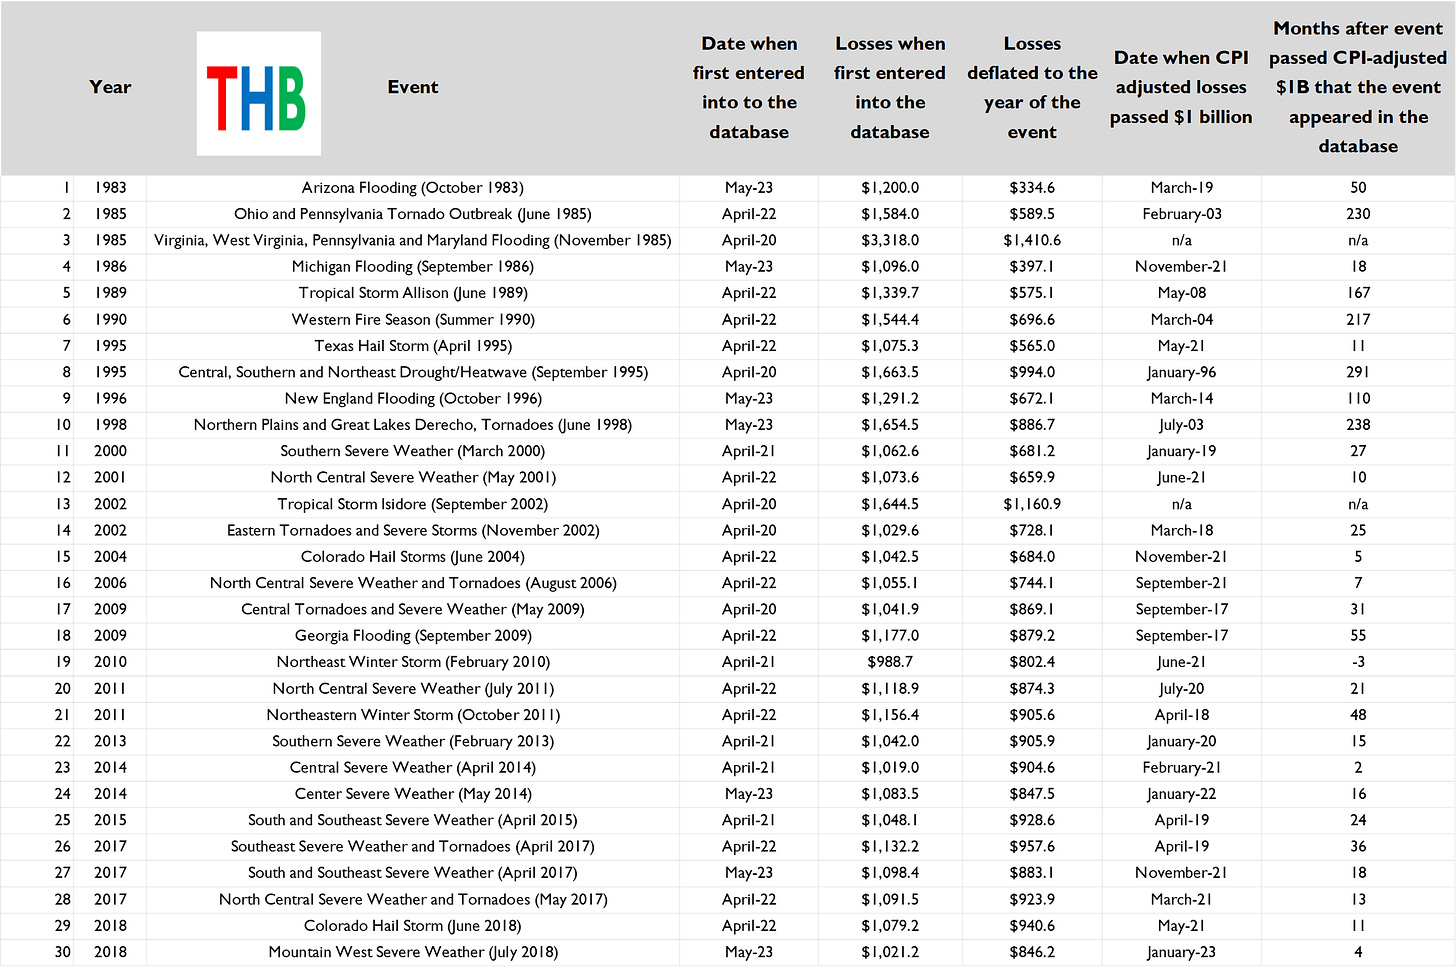
The table below shows the reverse engineering of the inclusion of 30 historical disasters (pre-2020) which were added to the tabulation over the 18 versions from 2020 to 2024.8
The table shows, in its columns from left-to right (you can click on the image to enlarge it):
The year of the event;
NOAA’s name for the event,
the date when the event was entered into the dataset,
the losses recorded when first entered,
the losses deflated (using CPI) to the year of the event,
the actual date when CPI-adjusted losses exceeded $1 billion in current dollars (and thus when they should have been added to the tabulation),
and the time (in months) between when they should have been added and when they were actually added.
The archive reveals a methodological mess.
For instance — Two events were always billion dollar disasters, even in the year that they occurred. Most were added years or even decades after the estimated losses passed an inflation-adjusted billion dollars, and when they should have been added to the tabulation. Another event was added before reaching the billion-dollar threshold. The archive also shows that twice as many events were added to the tally that occurred from 2000 to 2019 versus from 1980 to 1999.
The curious methods applied here further boost the overall trend in simple counts of billion dollar disasters.9
Failed Replication of Two Recent Events
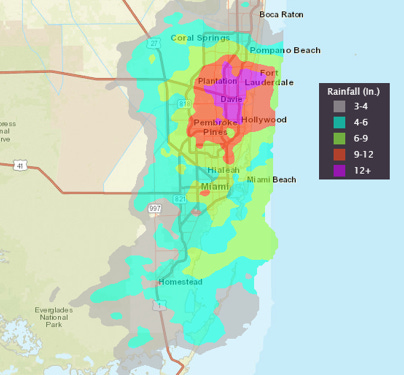
Fort Lauderdale Flood 2023
NOAA/NCEI reports $1.133 billion in losses for this flood event. I contacted several colleagues in the private sector who are involved with loss estimation and asked them about total estimated losses. They told me (anonymously) that the event’s losses include:
$204 million in insured losses, including:
$143 million auto
$46 million homeowners
$15 million commercial
$236 million in National Flood Insurance Program claims
$100 million in public infrastructure losses
That totals well less that $600 million, and less than half of the NOAA estimate.
What accounts for the difference? NOAA won’t release its data or sources so it is impossible to know.
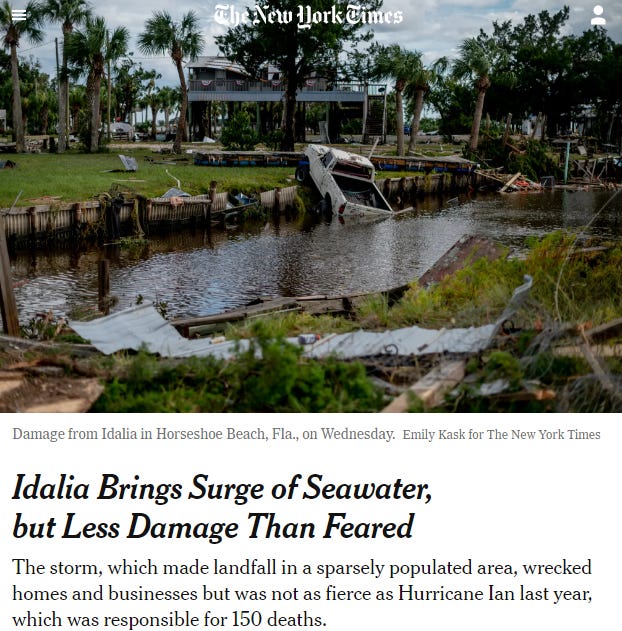
Hurricane Idalia 2023
NOAA reports $3.525 billion in total losses for this Category 3 hurricane which made landfall in the Big Bend region of Florida last year. According to the State of Florida, there has been about $310 million in insured loss claims. Using the conventional methodology of the U.S. National Hurricane Center, this would result in a total loss estimate of well less than $700 million — or about one sixth the NOAA estimate.
What accounts for the very large difference? NOAA won’t release its data or sources so it is impossible to know.
These two disasters are just examples of dozens more that raise questions of how NOAA determined its loss estimates. There is a curiously large number of disasters that just reach the $1 billion threshold, many of which involve rolling up convective storm losses across time and space to reach that total.
The absence of underlying data and methodological transparency means that there is no way to know what is included in the estimates.
One lesson here is obvious: NOAA should not be in the business of keeping score and playing the game at the same time. If the federal government is to engage in disaster loss estimation, then that function should be performed by an independent agency, such as the Bureau of Economic Analysis, subject to independent peer review, and involving experts with economics and loss-estimation expertise, which falls outside of NOAA’s mission.
The billion dollar disaster tally started out as clever clickbait marketing for NOAA — but somewhere along the way took on a life of its own and now poses risks to the agency. It is a case study in the social construction of ignorance. Fortunately, science is self-correcting and NOAA is a leading science agency.
The 18 versions of the hidden-in-plain-sight billion dollar disaster tabulation allow us to see how the tally changes from version to version. The changes across various versions show clearly that NOAA has implemented methodological choices that in each instance artificially boost the counts of billion dollar disasters.
I’ll revisit this topic when NOAA responds to my request for correction. For today, I close this post with how I ended my recent paper:
“NOAA is a crucially important agency that sits at the intersection of science, policy and politics. It has a long and distinguished history of providing weather, climate, water, ocean and other data to the nation. These data have saved countless lives, supported the economy and enabled significant scientific research. The agency is far too important to allow the shortfalls in scientific integrity documented in this paper to persist. Fortunately, science and policy are both self-correcting.”
Below is a link to an Excel file with each of the 18 versions of the tabulation. I invite you to have a look yourself and to report what you find in the comments.
❤️Please click the heart to help this post reach more readers!
Thanks for reading! The work I do here at THB and the community that we have created depends entirely on your support. Please share, subscribe, and join the community of supporters, honest brokering is a group effort. Comments, discussion, critique are invited — and all are welcome.
The tabulation was updated 18 times in just over 4 years, suggesting that there may be 80 or more additional versions of the dataset dating back to 2000.
Thanks to Mike Pugh at AEI for assistance.
The lack of transparency leads to an inference that the methods employed are not in fact justifiable.
Disclosure: I was a Fellow in a NOAA-university cooperative institute for 16 years, and have many friends and colleagues in the agency. Safe to say, I am a fan.
I invite readers to download the 18 different iterations of the BDD tabulation, to check my work, and to explore further questions. I have only just scratched the surface. A downloadable Excel file is linked at the bottom of this post.
Versions 3, 5, 12, and 17 had no inflation adjustment applied.
There may be other factors that go into changing past disaster loss estimates which have not been revealed by NOAA. Publicly, the only adjustment that NOAA acknowledges is the CPI adjustment.
There were 5 additions of historical disasters (pre-2020) made in Version 2, Version 6: 5, Version 10: 13, and Version 14: 7 — for a total of 30.
Unexplored here are events of the past which should have been included but were not.


Here is an example of an 1980 event that would be about $2.5B in 2024 dollars that does not appear in the current BDD tally:
"Fujita and Wakimoto (1981) provided extensive documentation of the 16 July 1980 derecho that produced widespread damage across large areas of Michigan, Illinois, Wisconsin, and Minnesota. They indicated that this storm produced approximately $650 million in damage as it traversed the four-state region. Accounting for inflation (to 2003 dollars), this storm produced an estimated $1.3 billion in damage from strictly straight-line winds. This estimate exceeds many damage tallies from U.S. hurricanes and is larger than the inflation-adjusted damage estimates from all major tornadoes that have affected the U.S. since 1890 (Brooks and Doswell 2001). This single event illustrates that derecho damage can exceed the damage from most hurricanes and tornado events affecting the contiguous U.S."
Where is this info from? NOAA
https://www.weather.gov/dtx/1980derecho
There are many such events that somehow escaped NOAA's notice
Good post Roger! The mainstream media, (the old "fourth estate") was supposed to hold government and those in power feet to the fire, but they have become ideological chearleaders & sychophants.
Rayner's 2012 article was titled "Social Construction of Ignorance" rather than your "constriction" (but your term kinda works with regard to knowledge: Would not want all us unwashed masses to learn the truth. Lol).
Thx for all your references & links!