Two Things All ESG Investors Should Know About Climate Scenarios
Scenarios are so complex that implausibility is often invisible making misuse inevitable
ESG investing “generally refers to the process of considering environmental, social and governance (ESG) factors when making investment decisions.” According to Bloomberg Intelligence, “Global ESG assets are on track to exceed $53 trillion by 2025, representing more than a third of the $140.5 trillion in projected total assets under management.” Within those trillions of dollars of investment, “climate remains king.” Not surprisingly in this context, climate scenarios represent a massive business opportunity.
In this post I’ll highlight two things all ESG investors should know about the climate scenarios that have become ubiquitous in ESG investing and in finance more generally. As I prepared this post, my first draft listed five things. The other three will have to await another time as discussing the first two is a post unto itself.
The maddening complexity and impenetrability of climate scenarios means that they are often put to use without users having a real understanding of their strengths and weaknesses, much less what lies inside the black box. Even worse, in some cases the climate scenarios being used to inform trillions of dollars of investment may be obsolete or completely untethered from reality. Misallocated resources and other bad decisions may result.
Let’s take a look at two important things that everyone who uses climate scenarios in ESG and finance should be aware of.
No one evaluates scenarios for plausibility
Climate scenarios are supposed to be plausible representations of the future. Indeed this is the main claim found on the homepage of the Scenarios Portal of the Network for Greening the Financial System (NGFS), as you can see in the screenshot below.
The NGFS uses a scenario called “Hot House World” to project a future that is characterized by implementation of “current policies.” A first iteration of “Hot House World” projected increasing carbon dioxide emissions from fossil fuels through 2100, and a 3.6 degrees Celsius global average temperature increase to 2100. The NGFS, like others, realized a few years ago that its first iteration of scenarios “were designed about 10 years ago and do not match well with recent emissions trends.” In other words, they were obviously implausible. So as users were busy employing Hot House World 1.0, NGFS developed a new set of scenarios which included a Hot House World 2.0 scenario that dramatically reduced projected emissions to 2100 and associated global temperatures, to 3.1 degrees Celsius.
But even that updated scenario was already out of date in 2022. Fortunately, the NGFS has another baseline scenario, called NDCs (referring to the “Nationally Determined Contributions” of the UN Framework Convention on Climate Change), which further reduces projected emissions to 2100 and projects associated global temperatures of 2.5 degrees Celsius. However, most users continue to employ the out-of-date and implausible Hot House World 1.0 and 2.0 scenarios.
The repeated ratcheting down of expectations for future emissions and temperature change is good news, and consistent with that I’ve reported here for quite a while (see this and this). But the frequent changes can be confusing for users of scenarios, many who require months and even years to implement scenarios in risk assessment and stress testing. To be fair, the issues I raise here are not at all unique to the NGFS — there are dozens, hundreds, thousands of scenarios out there in the climate space. Making sense of plausibility is an enormous challenge for anyone.
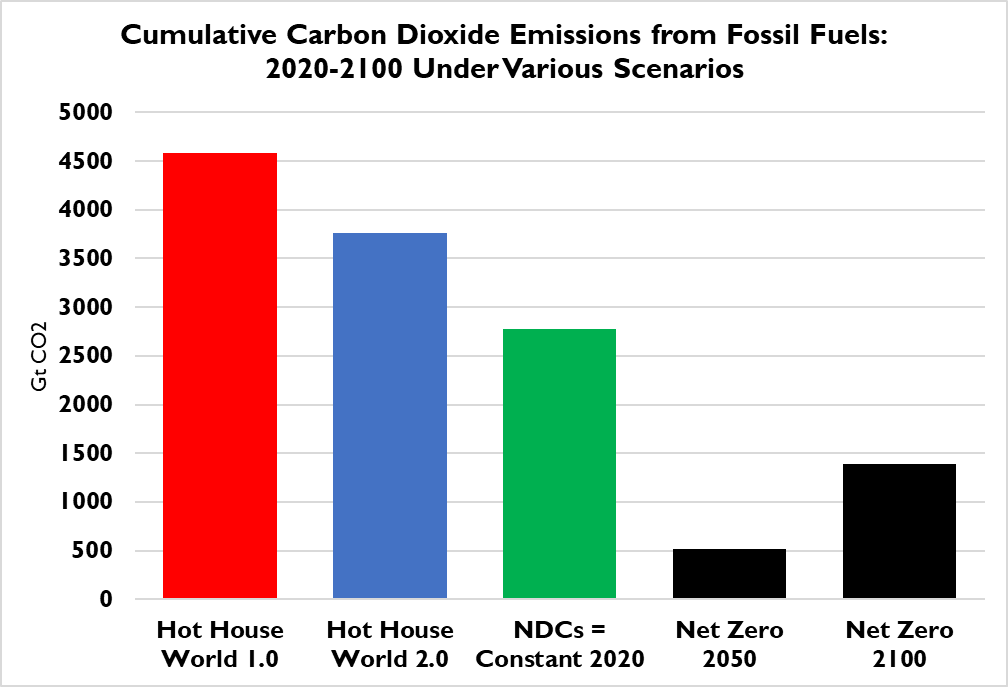
In the graph below, you can see projected 21st century carbon dioxide emissions from fossil fuels for three NGFS scenarios, updated from my Senate Banking Committee testimony last year. Also shown in the figures are cumulative emissions associated with achieving net-zero carbon dioxide by 2050 and by 2100. As I wrote the other day, at the current rate of growth in carbon-free energy consumption, the world is on track to achieve net-zero in 2197 (which would increase the Net Zero 2100 bar to about 1,750 Gt).

So what scenario should scenario users employ to represent a plausible worst-case scenario for purposes of stress testing? That depend on who you ask. Consider these different approaches:
The European Central Bank in 2021 used Hot House World 1.0, and in 2022 Hot House World 2.0
The International Monetary Fund recently implemented NGFS NDC scenarios as a baseline
The Bank of Canada in 2020 used the so-called “business-as-usual” scenario of the IPCC AR5 (not shown here, but over 7,000 Gt for RCP8.5)
The 2022 stress testing by the Bank of England used a bespoke scenario projecting 3 degrees Celsius by 2050 (far above both NGFS Hot House Worlds and all IPCC RCPs — more on that below)
What is a plausible worst-case scenario for stress testing? Who knows. Its a question that scenario users should ask before using scenarios, rather than just taking a scenario off the shelf.
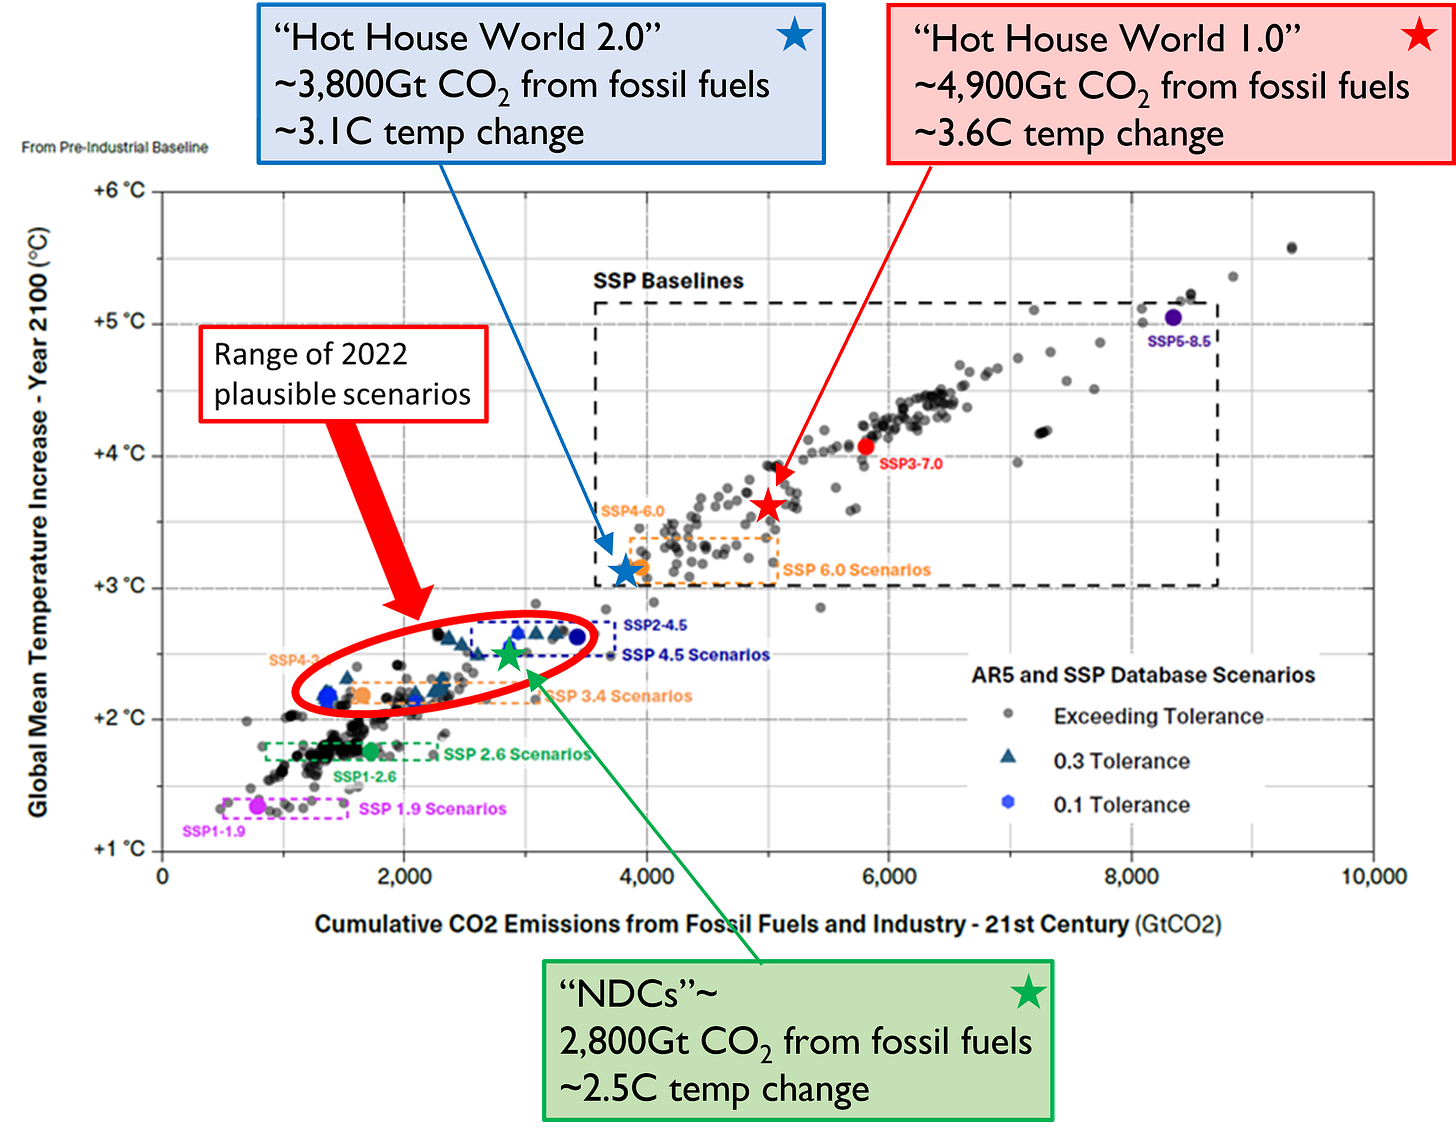
For the more technically inclined I include a figure below from our recent research on plausible scenarios of the IPCC AR5 and AR6, which displays the three NGFS scenarios in relation to the entire RCP and SSP databases.
All plausible scenarios under our methodology lie between 2 and 3 degrees Celsius for 2100, and suggest a “worst case” scenario of about RCP4.5 or SSP2-4.5, consistent with the NGFS NDC scenario. How many users employ the NDC scenario as a worst-case baseline for stress testing? Not many.
There is little to no consistency in the development or use of scenarios, meaning that different assumptions about plausibility are employed (or plausibility is just ignored) and the results of various analyses are uneven and not comparable with one another. While these examples focus primarily on central banks, you will find inconsistency in scenario use across companies doing ESG work and as well among the ESG consultancies that they rely on (and pay quite well).
Scenarios often employ assumptions contrary to the IPCC consensus
Periodically, the Intergovernmental Panel on Climate Change goes to great length to assess the sprawling literature on climate science, impacts and vulnerability, and mitigation. This work is often ignored in ESG climate-related work, or its even rejected in favor of far more extreme projections that lack much (or any) scientific basis. Here I’ll illustrate significant and illustrative examples of departures from consensus science by the Bank of England in its recent stress testing. To be sure, the examples here from the BoE are far from unique — I could write dozens of posts with similar examples (and if you check my Twitter feed, you’ll see many).


