Tracking Progress Towards President Biden's 2030 Emissions Reduction Target
President Biden has announced ambitious goals for climate policy, here is how we can track policy progress on a monthly basis
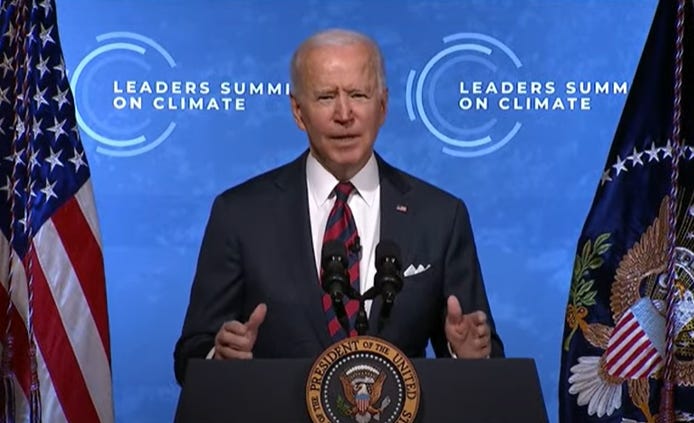
Today, President Biden announced “a new target for the United States to achieve a 50-52 percent reduction from 2005 levels in economy-wide net greenhouse gas pollution in 2030.” This commitment represents the most ambitions emissions reduction target in U.S. history and, if successful, a major step forward in climate policy.
Tracking progress on climate policy commitments can be challenging because of the complexity of the targets and their indicators. Here, I provide a very simple and intuitive metric for tracking policy progress on a monthly basis.
First, it is important to understand the target. The focus is not just on carbon dioxide emissions, which according to the Intergovernmental Panel on Climate Change is the main factor driving climate change. The focus in on “greenhouse gas pollution” which includes other pollutants, such as methane, nitrous oxide and fluorinated gases. Typically, the effects of non-carbon dioxide gases are converted into “carbon dioxide equivalents” based on their projected future impact on climate change. The associated emissions reduction target is based on the collection of gases, not just carbon dioxide. In 2019, carbon dioxide was responsible for about 80% of total U.S. greenhouse gas emissions.
Second, in the United States the year 2005 is usually chosen as a baseline for measuring emissions reductions, because it is near peak U.S. emissions. So any emissions reduction target will look a lot better with a peak year as a baseline. An emissions reduction target of 50% from 2005 levels is about the same as an emissions reduction target of about 35% from 2020 emissions.
Third, the Biden emissions reduction target is focused on “net” emissions. To achieve the target emissions are expected to be reduced from “electricity, transportation, buildings, industry, and lands.” The land is a part of the carbon cycle and can be a source of or sink for carbon. In the United States, land has been a sink, so in a “net” calculation the land offsets other emissions, such as from power plants or cars.
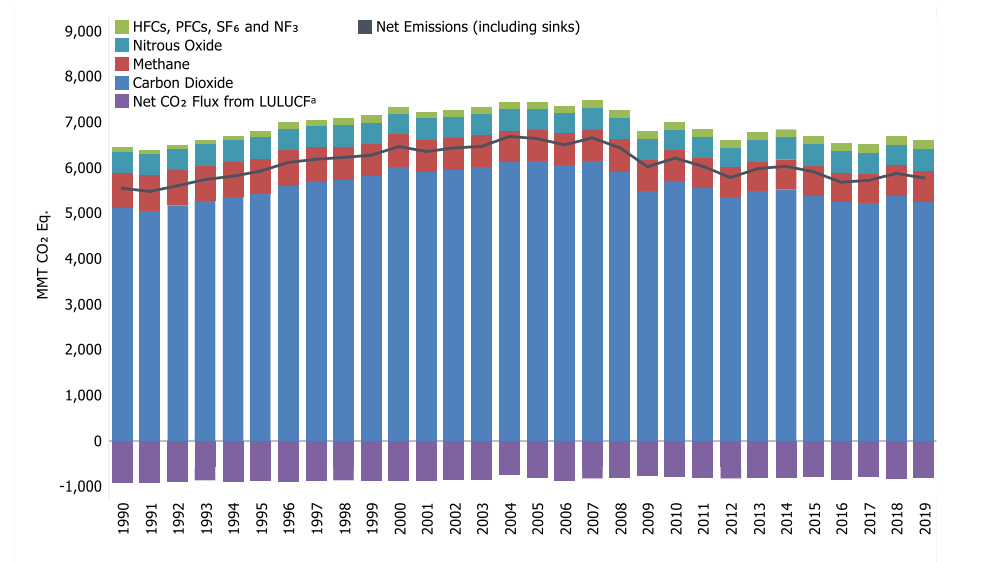
The figure below from the US Environmental Protection Agency summarizes the three paragraphs above in a single graph, showing carbon dioxide emissions (blue), other greenhouse gases (red and green above the blue) and the land sink (purple below the zero line) with the net emissions shown as the black line.
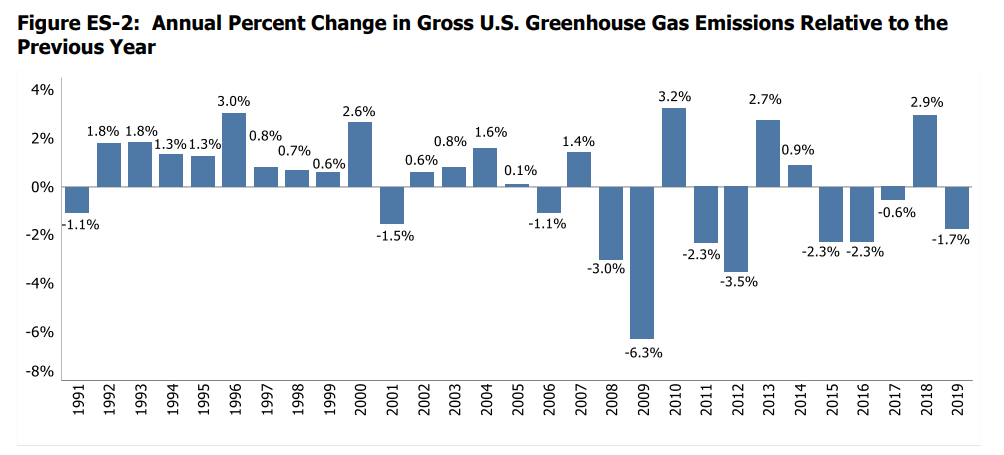
Net greenhouse gas emissions were 6.635 gigatonnes (Gt) of carbon dioxide equivalent in 2005, so a 50% reduction target is 3.318 Gt in 2030. In 2019, there were 5.769 Gt of net emissions, meaning that by 2030, the U.S. will have to reduce its emissions by about 2.450 Gt, or more than 270 Gt per year. That equates to an annual rate of emissions reductions of about 6.3% to 2030. As the figure below shows, prior to Covid-19, such a rapid rate of annual decrease in emissions has only occurred in 2009, the year of the global financial crisis.
The calculation of greenhouse gas emissions is highly technical, involving a basket of gases, land use estimates and various conversions. That can make tracking progress difficult. It also creates opportunities for creative accounting.
Here I provide a simple, intuitive way to track the Biden Administration’s progress with respect to its climate target that can be updated monthly as new data comes in.
President Biden’s net greenhouse gas reduction target is supported by his commitment “to create a carbon pollution-free power sector by 2035.” According to EPA, in 2019 electric power produced about 29% of US greenhouse gas emissions. Crucially, reducing electric power to zero emissions achieves well over half of the overall greenhouse gas reduction target.
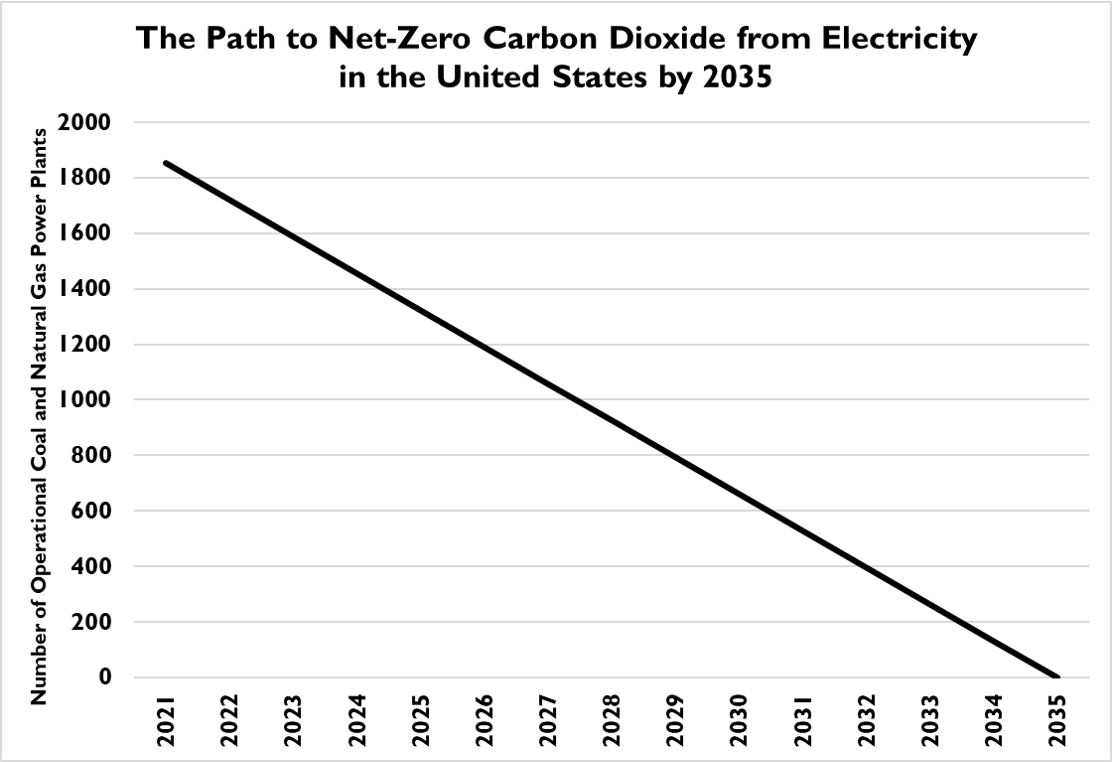
In January 2021, according to the US Energy Information Agency in the United States there were 1,852 coal and natural gas power plants that generated electricity. By 2035, to hit President Biden’s target all of these power plants will have to be either shut down or converted into zero-emissions power plants (using carbon capture and storage technologies that presently do not exist).
There are 164 months until 2035. That means that more than 11 of the fossil fuel power plants operational in January 2021 will need to be closed every month, on average, starting today until 2035. Tracking progress on the closure (or conversion to carbon-free) of power plants can provide a very useful marker of progress toward achieving the Biden Administration’s overall climate targets. The figure below shows a linear trajectory for power plant closures, necessary to hit the 2035 net-zero.
By Earth Day 2022 the US will have needed to close more than 100 power plants that were producing electricity in January, 2021 in order to be close to the trajectory set forth by the new emissions targets. EIA reports these data monthly so a more frequent accounting is possible. A strength of this approach is that it allows for independent verification of reports of progress, and in particular, an assessment of whether methodological changes to GHG equivalencies or land use are used to game the results.
I’ll update these data periodically, stay tuned!


This may be OT but you might enjoy my strategic analysis of the Biden climate agenda:
https://www.cfact.org/2021/04/24/the-biden-climate-summit-speeding-up-to-hit-the-wall-harder/
I am not seeing how Roger.
https://www.iea.org/data-and-statistics/?country=USA&fuel=Energy%20supply&indicator=TPESbySource