Later this week on Colorado’s beautiful Western Slope, I’ll be giving a keynote talk at an energy transition conference. The timing is perfect because I get to share some of my first analyses of the 2024 edition of the Energy Institute’s Statistical Review of World Energy — an absolutely indispensable resource that was just released a few days ago.
In my talk I argue that energy policy is a four-legged stool which to be structurally sounds needs attention to each of the four legs, which I summarize as — cost, impact, access, and security. U.S. and global energy policies have often been less than structurally sound because of a myopic emphasis on one or a few of these legs while ignoring the others.
Today, I share some of the graphs and data that appear in my talk. I should mention that as I transition away from academia I will be seeking more speaking opportunities — So if your organization may be interested, please be in touch, I’m worth it.
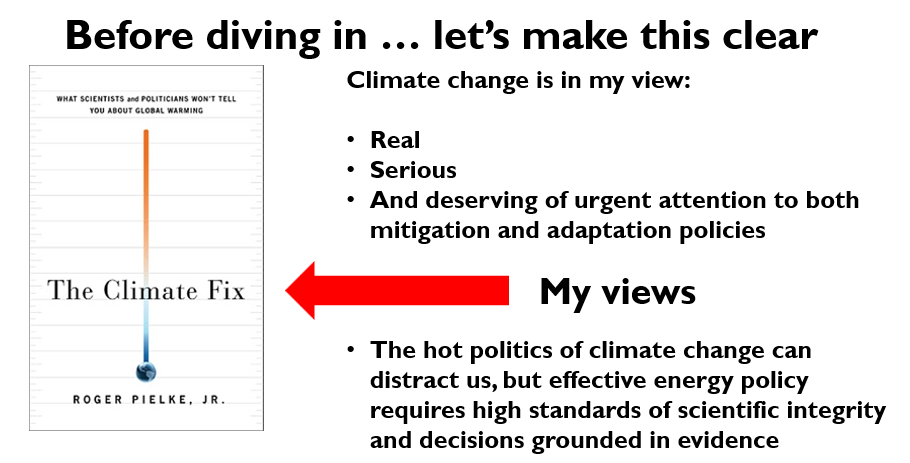
My talk won’t be about climate change in any detail, but I often open my talks on energy policy explaining that climate change is real and serious. I’m always happy to discuss the subject and to emphasize the importance of science and evidence over narrative and vibes. However, it is also true that legitimate concerns over climate impacts have a way of distracting us from the other three legs of the stool. Climate matters, but it is not everything.
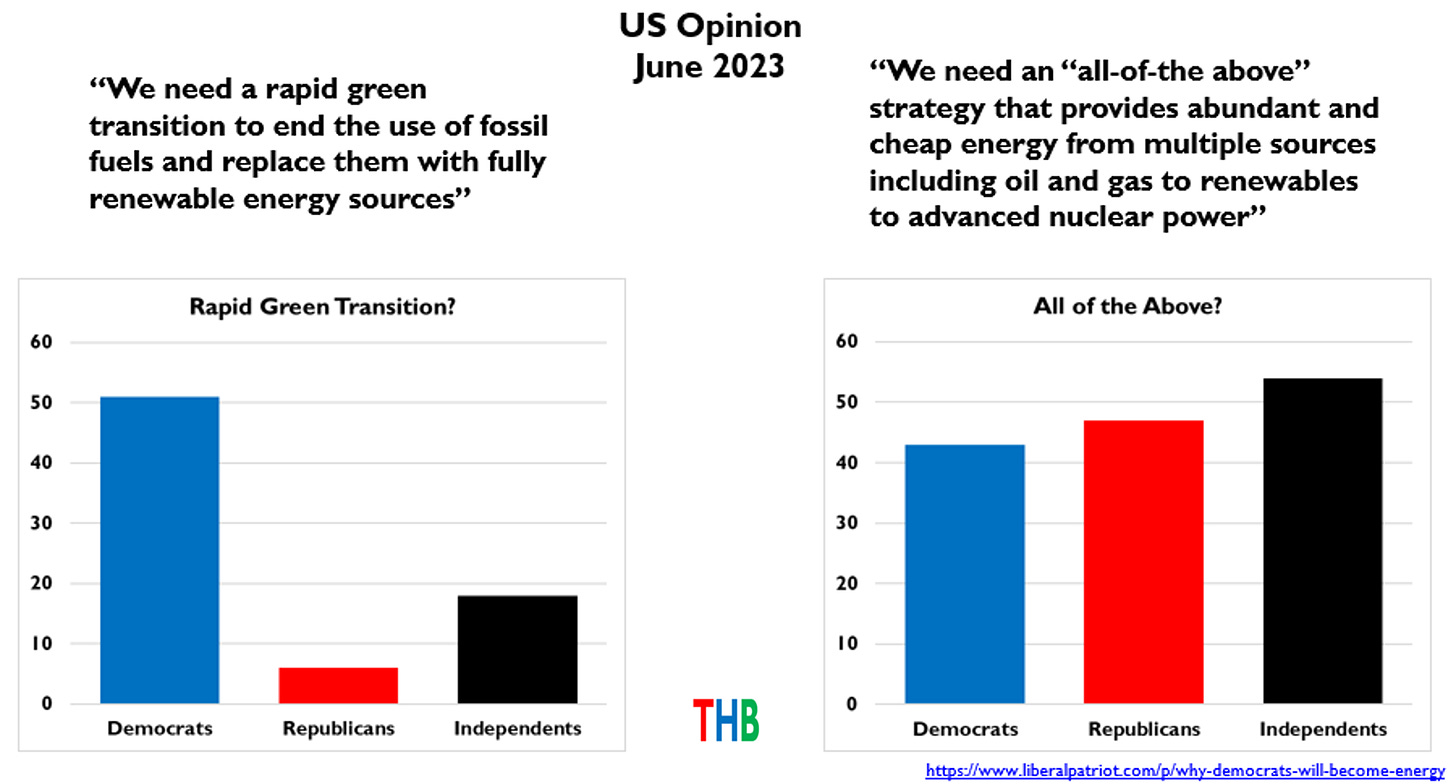
An AllotA approach to energy policy has proven to be remarkably popular and bipartisan in polls of American voters. In contrast, net zero and green proposals are popular with most Democrats, but no one else. Ruy Teixeira observes that in the U.S. “climate first” voters are only 4% of the electorate and they prefer Biden to Trump by a margin of 96%. AllotA offers an enormous electoral opportunity for whomever takes it on.
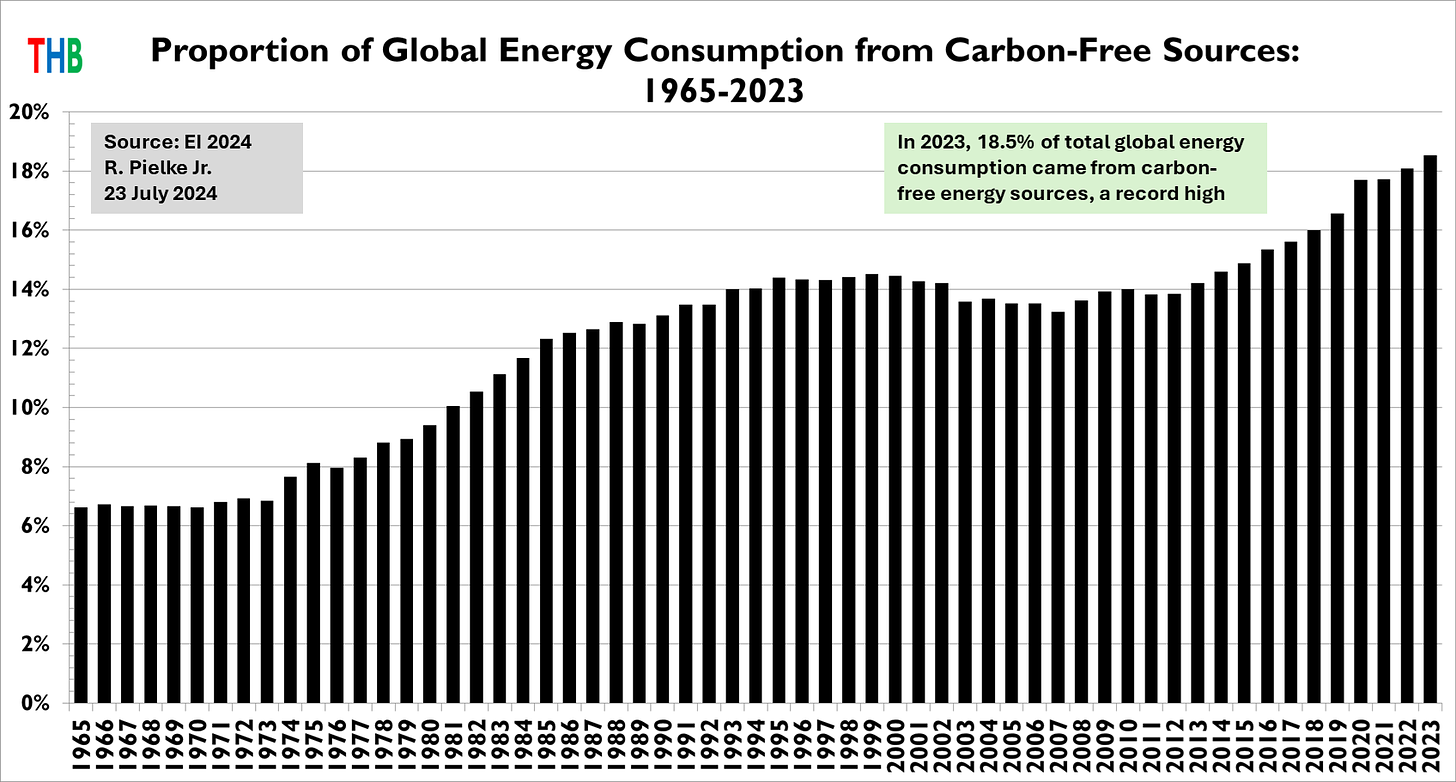
In 2023, the proportion of the world’s energy consumption that came from carbon-free sources continued to increase, reaching 18.5% of total consumption. At the rate of increase in the global proportion of carbon-free energy since 2015, the world would be on track to hit net zero in 2203.
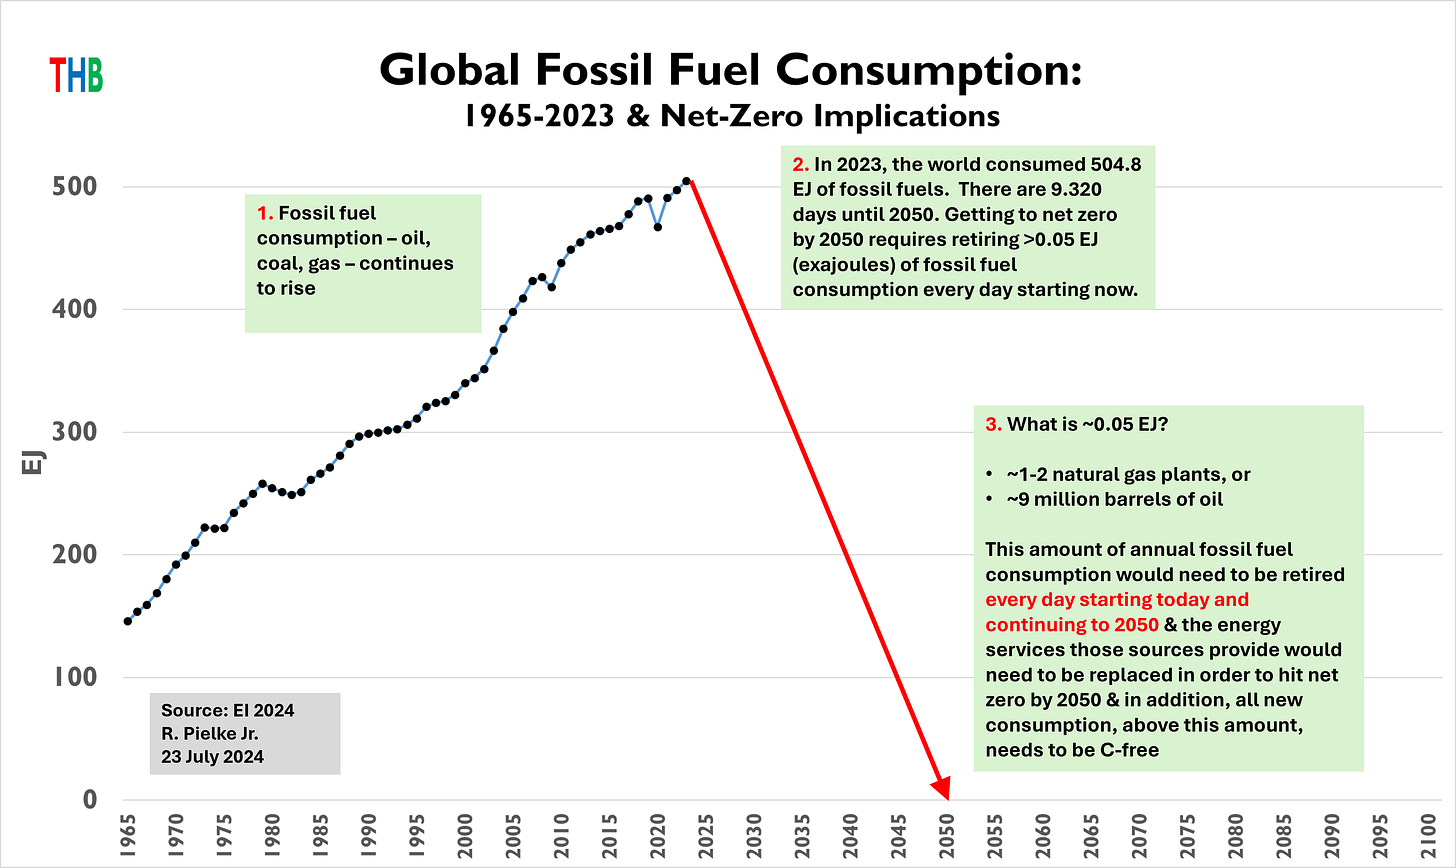
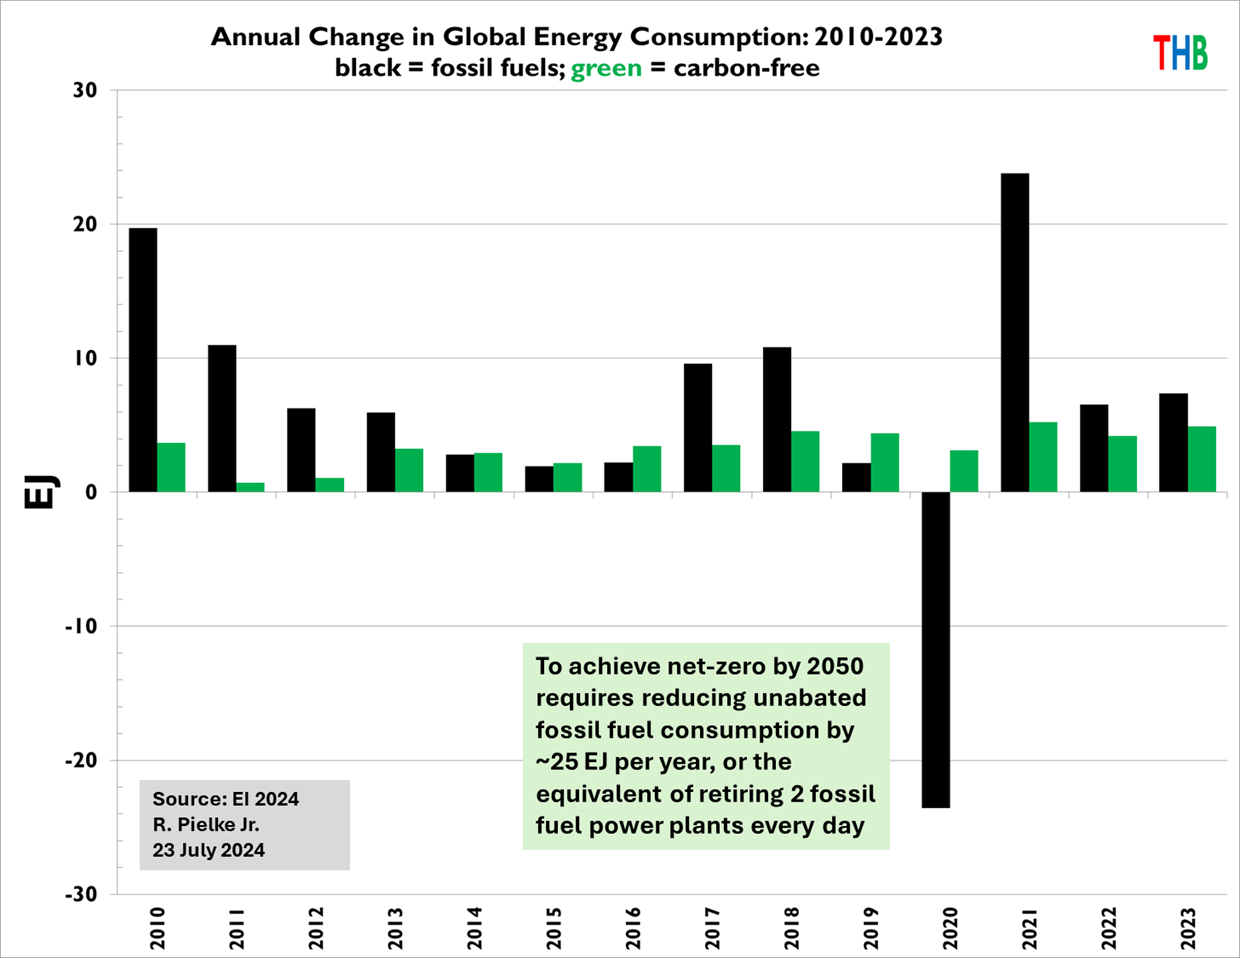
In 2023, fossil fuel consumption continued to increase, surpassing 500 exajoules (EJ) fro the first time. The route to net-zero by 2050 gets steeper every day. Remember, the deployment of carbon-free technologies does not reduce carbon dioxide emissions, only the retirement or abatement of hydrocarbons reduces emissions. So far, fossil fuel consumption continues to grow.
In each of the past three years, the increase in fossil fuel consumption has outpaced increase in carbon-free consumption. In fact, since the adoption of the Paris Agreement in 2015 the world has increased fossil fuel consumption by 33.5 EJ and carbon-free consumption by 30.6 EJ. To be on track for net zero by 2050, unabated fossil fuel consumption would need to be reduced by about 25 EJ per year, or about the same reduction that occurred in 2020 during the pandemic.
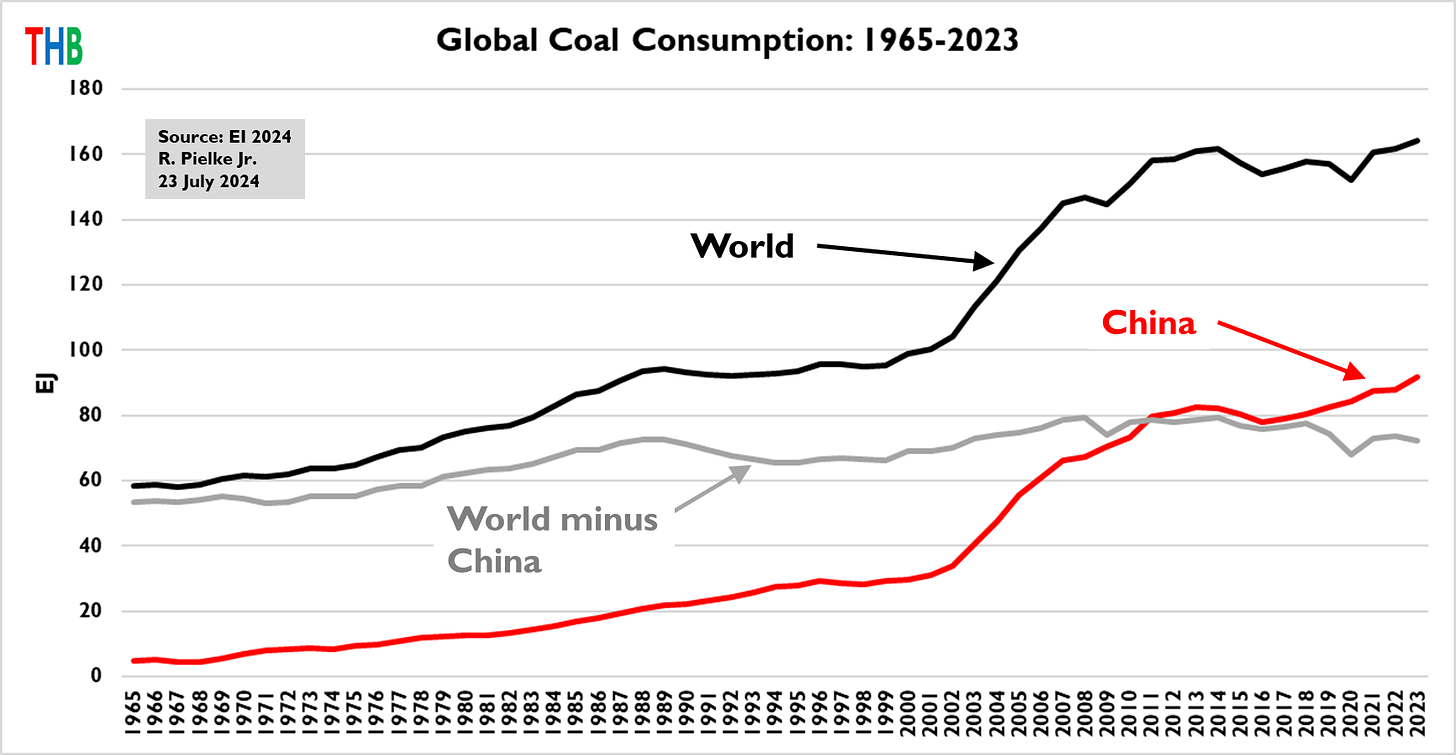
The asterisk in AllotA at the top figure in this post refers to coal, which I discuss at length in my talk. As a percentage of global energy consumption, coal actually peaked around 1900 (displacing wood). With the notable exception of China, the world passed peak absolute coal consumption almost two decades ago. Coal is on its way out, the only question is how long that will take — which is up to us.
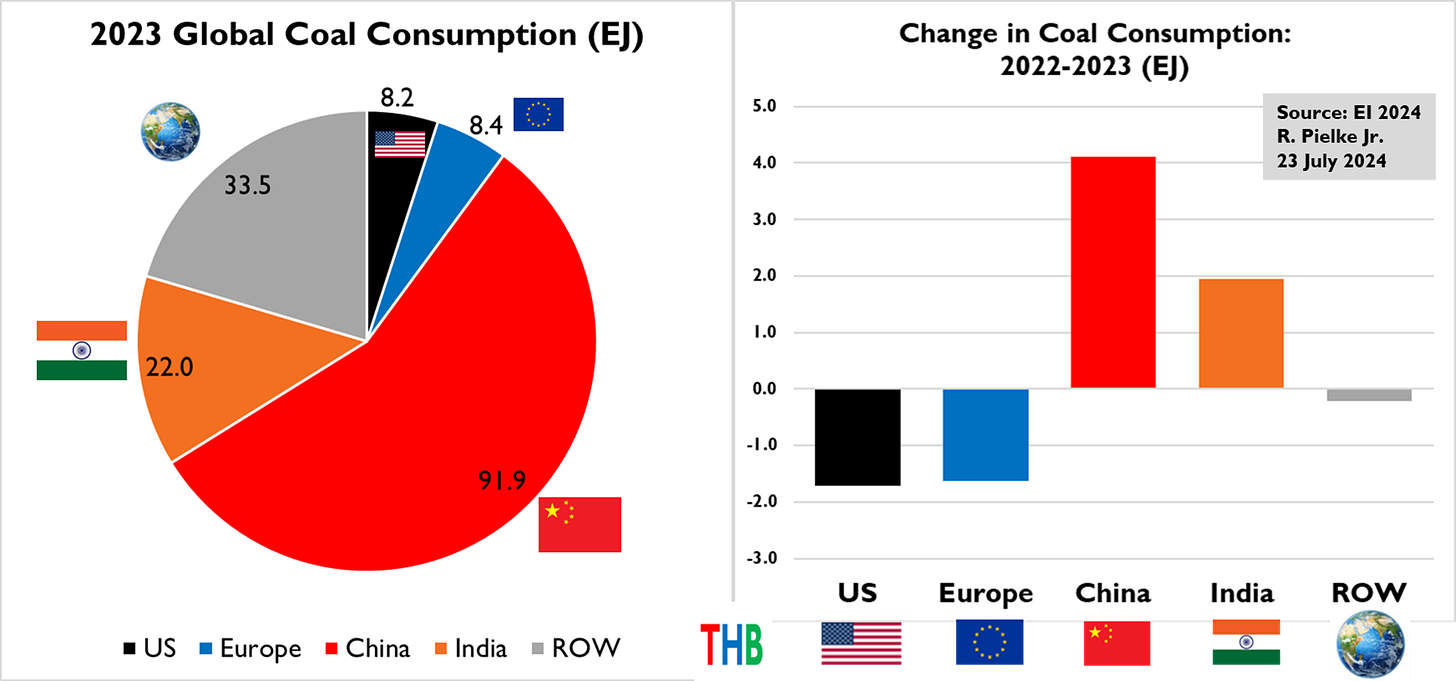
China and India together were responsible for all of the global increase in coal consumption from 2022 to 2023. Coal is hanging on in the U.S. and Europe, but barely.
The U.S. is the world energy superpower. I’ve argued before that should motivate Congress to start talking about a national energy policy. The enviable position of the U.S. in the world’s energy landscape should be a resource for advancing U.S. geopolitical interests and those of our allies. I am amazed at how little attention this leg of the stool gets from U.S. leaders of both parties.
Parts of my talk not shared here discuss global energy access and equity, the importance of the iron law, and how the future looks quite different than it used to.
I welcome your comments, suggestions, and discussion! THB is reader supported and reader engaged. I am constantly reminded of the incredible breadth and depth of expertise of the commenters here. I learn a lot, and appreciate your participation. Let me know your thoughts on the figures above — they are always works in progress. And if you are looking for a speaker, be in touch!



Excellent comments on this post. I'll start working through them with some responses, thanks!
I don’t know what the throat-clearing “climate change is real and serious” means. Isn’t that attitude how we got our irrational energy policy?