


Update: 9 Oct 2026: I replaced a figure in this post that was accidentally truncated in the original post. The analysis is the same. —RP
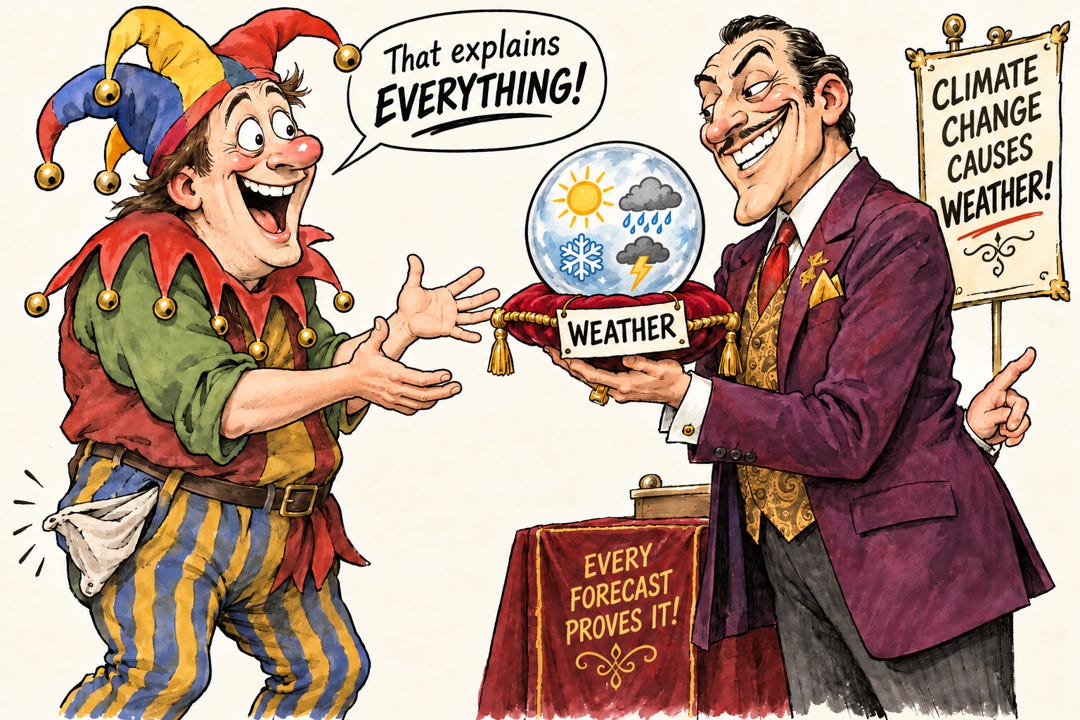
One of the most brazen — and successful — propaganda campaigns sits out in plain sight. I am referring to the concerted effort by climate advocates to create a belief that “climate change” causes bad weather and disasters, and that we can prevent those bad things from happening with climate policies.
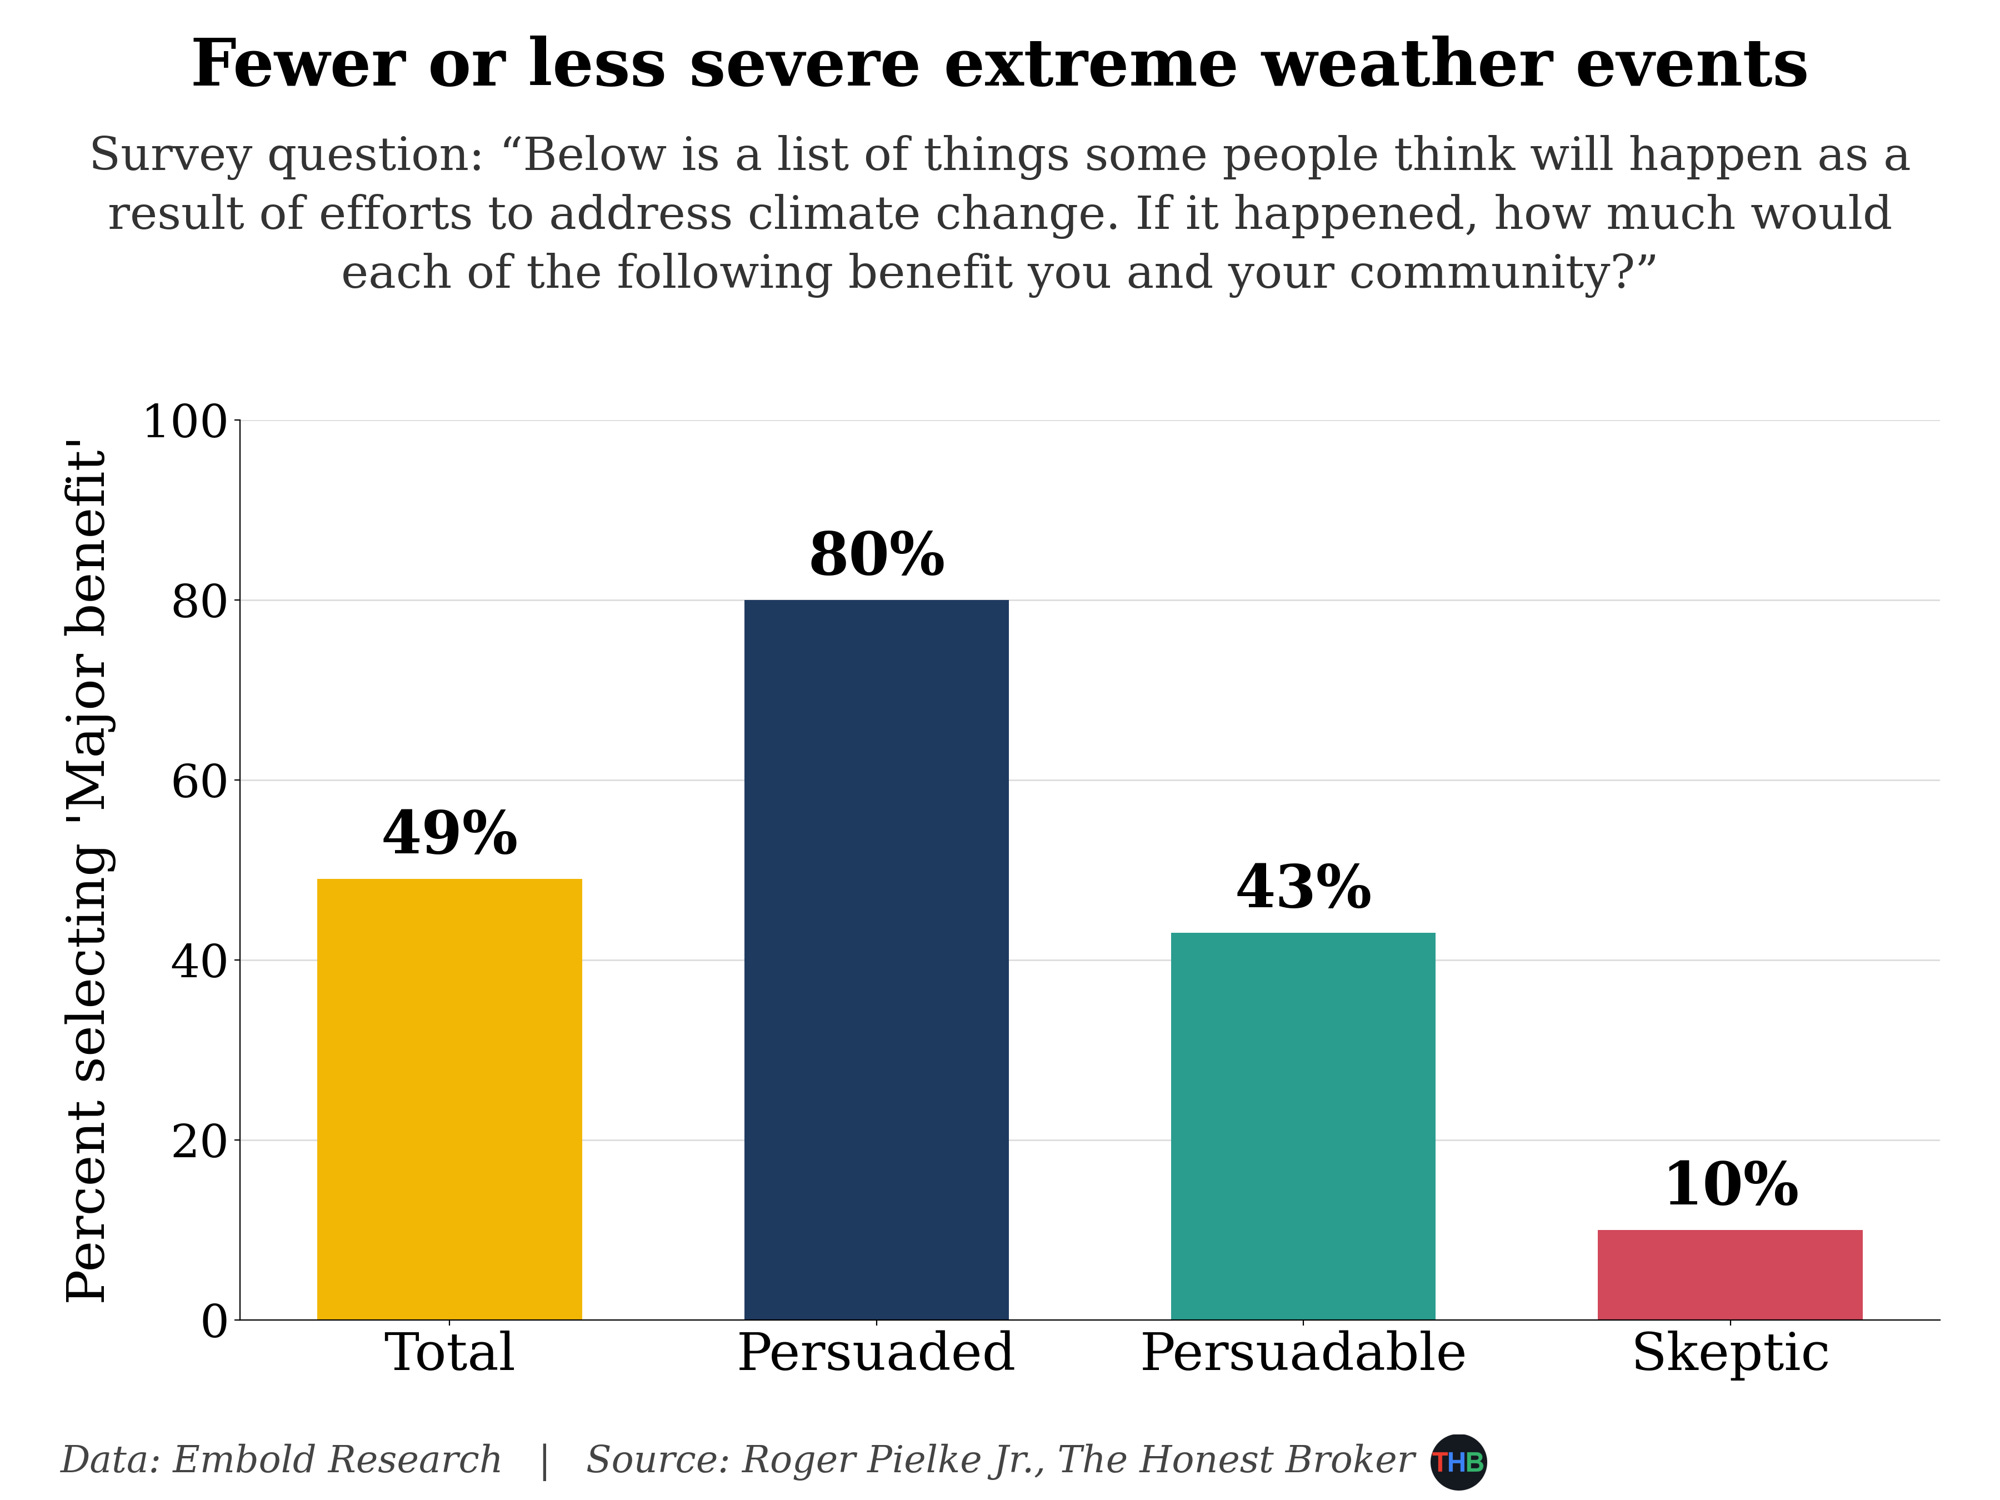
By successful, I mean that the propaganda campaign has convinced half of all Americans that “addressing climate change” will lead to “fewer or less severe weather events” that they personally experience and affect their community. As the figure below shows, among climate advocates, this belief is almost an article of faith at 80%.
At the center of the propaganda campaign are scientists who perform political alchemy by turning the symbols, authority, and institutions of expertise into public and policy maker (mis)understandings of climate science. These scientists all well know that “climate policy” — however construed — cannot reduce the number or intensity of extreme weather events in any meaningful or detectable way in my lifetime, or even my future grandkids’ lifetimes.
I am using the term propaganda here as a technical term, which Harold Lasswell defined almost a century ago as, “the management of collective attitudes by the manipulation of significant symbols.”
The fact that there is a propaganda campaign underway is not simply my characterization. The creators of “extreme event attribution” (EEA) — which this post is about — openly acknowledged that a primary reason for creating EEA is political: by “increasing the ‘immediacy’ of climate change, thereby increasing support for mitigation.”
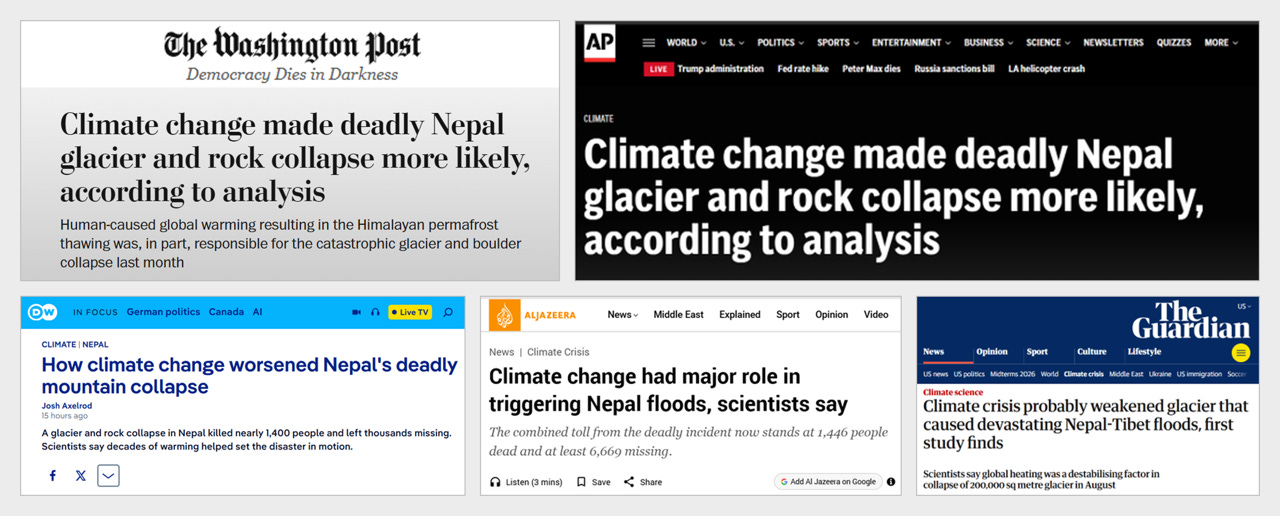
Today’s post is motivated by the “study” released today on climate change and the recent Nepal flooding and mudslide by World Weather Attribution (WWA) — reflected in the headlines above.
WWA explains, shamelessly and incorrectly, that “no existing early warning system could have provided sufficient lead time or prevented the scale of impacts observed in the worst-affected areas, highlighting the limits of adaptation.” They explain further that “minimising future risk requires a rapid transition away from fossil fuel use and delivering on climate finance commitments for adaptation.”
WWA functions as an advocacy group. It was created by Climate Central — another climate advocacy group — in 2014 and is today located at Imperial College London. WWA is funded by climate advocacy philanthropies: Grantham Foundation, the European Climate Foundation and the Bezos Earth Fund.
Today’s post does three things:
I show that the A in WWA should not be attribution, but assumption. The headline findings across all WWA press releases result from assuming attribution;
Further, under the WWA methodology any time series with a trend, up or down, — and in any context — can be “attributed to climate change.” Applying WWA methods, I’ll show how the record 6,776 home runs in MLB in 2019 would have been impossible without “climate change.”
I’ll also show how any variable with an increasing trend can be used to explain how a particular weather event was made worse. Applying WWA methods, I’ll show how the global increase in patent applications — patent change? — made the rainfall from a Japanese typhoon in 2019 four times worse that it would have been in the 1980s, with fewer patent applications.
Over the past few months, I have undertaken a massive project: I have replicated 96 WWA studies (the total for which data and methods allow replication, while about 30 others are not replicable) to evaluate the methods, how consistently they are applied, and how the press releases compare with what is in the technical reports. I have just replicated the Nepal “study” released today, which vividly illustrates problems found throughout the corpus.
WWA, reporters on the climate beat, climate advocates are playing us all for fools and in the process causing great harm to the science of climate change, which is too important to be reduced to propaganda in support of a political campaign.
Assumption, not Attribution
The creators of EEA have always been open about the fact that their claimed attribution of the likelihood or intensity of an event to causes is assumed, not shown or investigated.
In a foundational paper to the project, the authors explain of all trends in weather or climate variables:
“It is assumed that the main changes in the [statistical] distribution are due to global warming.”
In another core paper they explain that the only factor that they consider as relevant to extreme weather event is global mean surface temperature:
“the [statistical] distribution only shifts or scales with changes in smoothed global mean surface temperature (GMST) and does not change shape, [and] global warming is the main factor affecting the extremes beyond year-to-year natural variability.”
What about internal climate variability such as the profound influence of El Niño and La Niña (ENSO more generally) — Anyone notice all the Atlantic hurricanes this year? No, me neither.
The WWA methodology not only uses GMST as the only correlate with extreme weather, it smooths that variable over four years in order to eliminate any signal associated with ENSO:
For global warming a common choice is the 4-year smoothed global mean surface temperature (GMST) anomaly . . . The smoothing is introduced to remove the fluctuations in the global mean temperature due to ENSO, which would contaminate the global warming fingerprint with ENSO teleconnections.
The WWA methods use observations and also models. The use of models is also based on the assumption that changes observed in model output are due to emissions of greenhouse gases and aerosols (emphasis added):
“The second way is to use transient climate experiments, such as the historical/RCP4.5 experiments for CMIP5, and analyse these the same way as the observations. This assumes that the major cause of the trends from the late nineteenth century until now in the models is due to anthropogenic emissions of greenhouse gases and aerosols, neglecting natural forcings.”
The assumption that any and every trend in a weather variable is both an indication of “climate change” and caused by “climate change” makes a mockery of legitimate climate science.
Turnkey Attribution
The WWA methodology is ridiculously trivial but sufficiently mathematical and opaque to give a science-y veneer to its press releases and technical reports. The faux complexity also creates barriers to most of those who might want to peek under the hood. For those with the requisite expertise, who wants to be the one to point out the emperor’s not actually wearing any clothes?
To be fair to WWA, in the passages above, they’ve already told us that the emperor is naked!
So let’s look under the hood.
One of WWA’s foundational papers explained how it works with an example of temperatures in De Bilt, Netherlands. The first thing they did was compare the warmest day of the year at that location to global mean surface temperature (GMST) and calculate the linear relationship, shown by the dark red line in the figure below. The trend is about 2.8°C of local warming for each 1°C of global warming. The pink square shows the record daily temperature observed in 2018 — the event being attributed in the example.
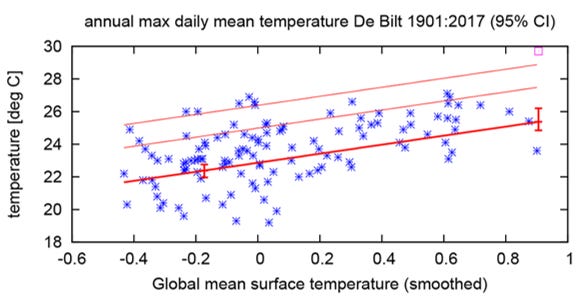
They then use the fitted relationship to create two return period curves — one for the contemporary climate and one for a past climate.
Let’s look at 1920 to show how the calculation works for an individual year: GMST increased by about 1.1°C between 1920 and 2018, and 1.1 multiplied by 2.8 comes to about 3°C. The method adds 3°C to the 1920 reading, so a 25°C day from 1920 counts as a 28°C day in the 2018 climate Then they do the same thing for all years to create a curve for the static 1900 climate.
The figure below shows the results of creating they temperature curves and converting them into return periods, showing how frequently events of different magnitudes appear in the record. The 2018 climate is shown in red and the 1900 climate is in blue.
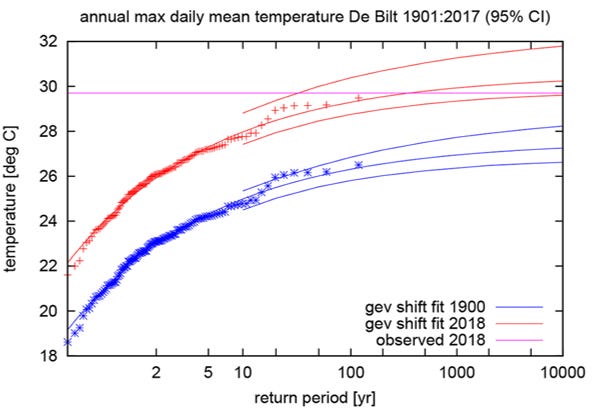
If you take a close look at the individual data points in red and blue you can see that they are the same data, just shifted based on the correlation between GMST and the local temperature.
The pink line is drawn at the level of the 2018 observed warmest daily temperature — 29.7°C. You can see that the pink line would never cross the blue curve, even if extended far off the page.
For this example, the authors conclude:
“[F]ormally the event was impossible in the climate of 1900 . . . However, this depends on a number of assumptions, so we prefer to say that the event was extremely unlikely around 1900.”
If the pink line were to cross the blue curve, then the conclusion would be that the event was made X% more likely by climate change.
WWA bolts on a comparison with models which are subject to the same assumptions. The simplistic methods are written up in a highly technical and jargon-filled report that does not undergo peer review. A press release is put out — that may or may not match up with the technical report (more on that in a future post) — and media around the world goes nuts.
Bravo to WWA and its funders. Seriously, they are giving a masterclass in propaganda technique for the modern era.
Attribute anything: Climate change causes more home runs
Let’s next apply the method to annual home runs in MLB. The figure below is exactly analogous to the De Bilt figure above — a regression of home runs on GMST. You can see that they are correlated. The purple square is the event we wish to attribute: the record 6,776 home runs of 2019.
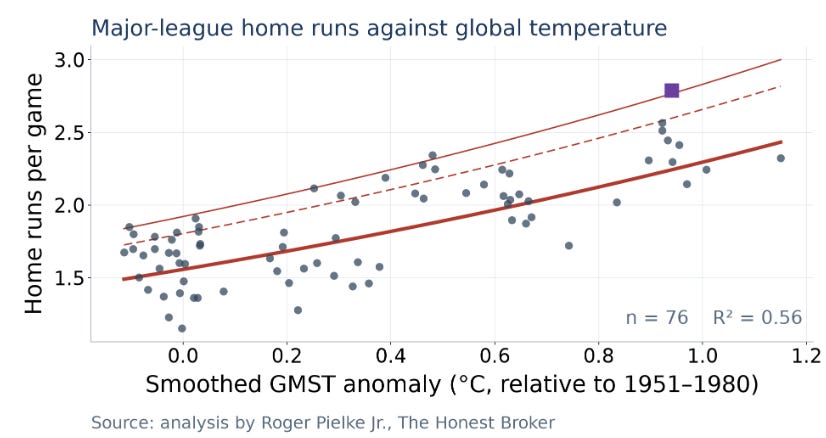
Taking the relationship of GMST and home runs established above, the figure below applies the WWA methods to show what home run counts would have been since 1900 with the counterfactual climate of 1900 and with the factual climate of 2025.
The pink line shows the 2019 record season could never have occurred in the climate of 1900 — which we can estimate by projecting back in time to 1900 the relationship shown above for 1950 to 2025, again under WWA methods.
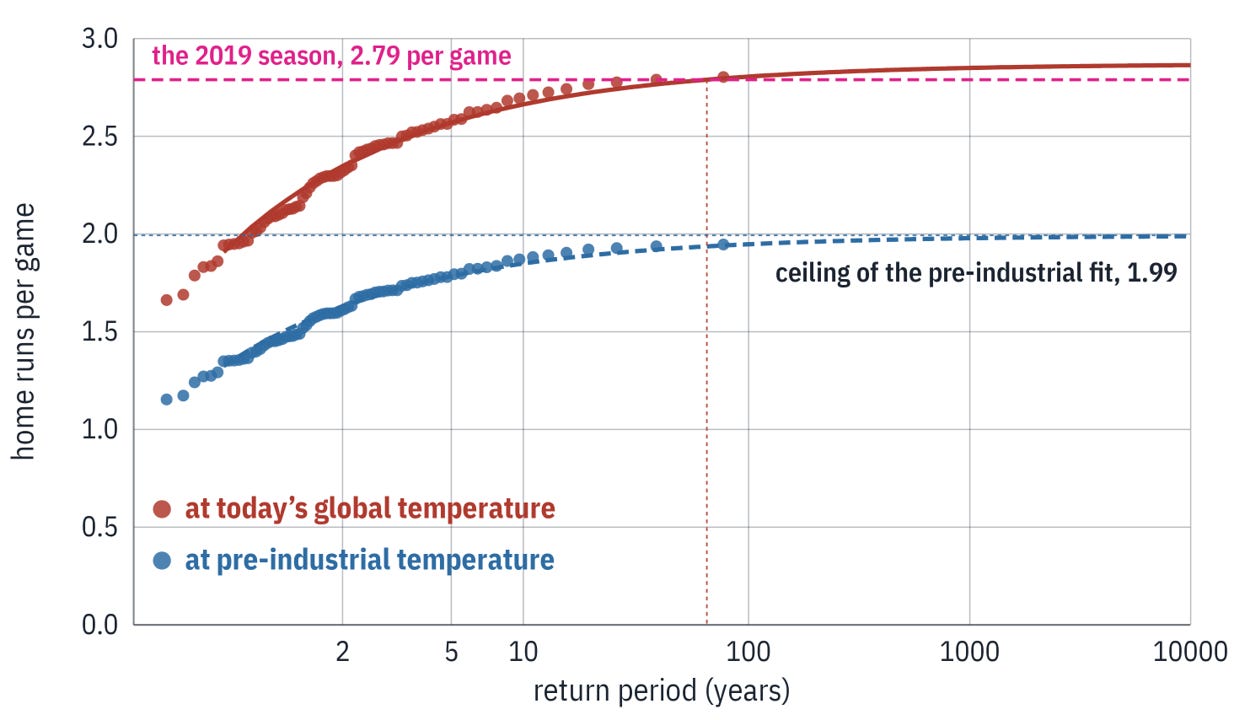
Did GMST cause the increase in home runs? The answer depends on what you wish to believe. If you believe that GMST represents “climate change” and “climate change” causes more home runs, then the answer is “yes.” WWA would appear to confirm your beliefs.
Does the curve shift represent the effects of “climate change” on the variable of interest (home runs in this example)? The WWA methods do not address that issue, they assume it.
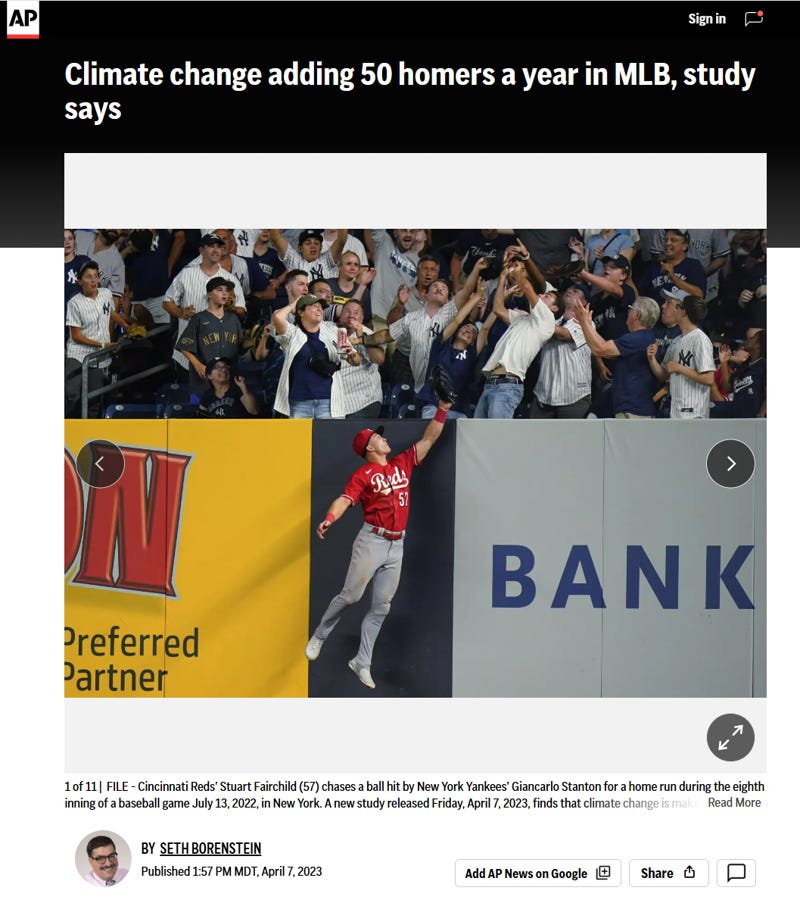
Before you laugh this off as a silly example, have a look at the very real screenshot below from the AP back in 2023 on a climate change attribution study of — home runs. You can see my take on that study here.
We can select any variable with a trend — literally anything — and put it in the place of home runs in this example and we can attribute any recent event to “climate change.”
EEA is a turnkey methodology designed to attribute anything you want to “climate change.”
And it doesn’t stop there. It also works in reverse.
A placebo test: Patent applications cause worse flooding
Let’s say I believe that the increase in the number of world patent applications — patent change — is the cause of specific extreme rainfall events. Silly, I know. But patent change works perfectly well in the WWA methodology.
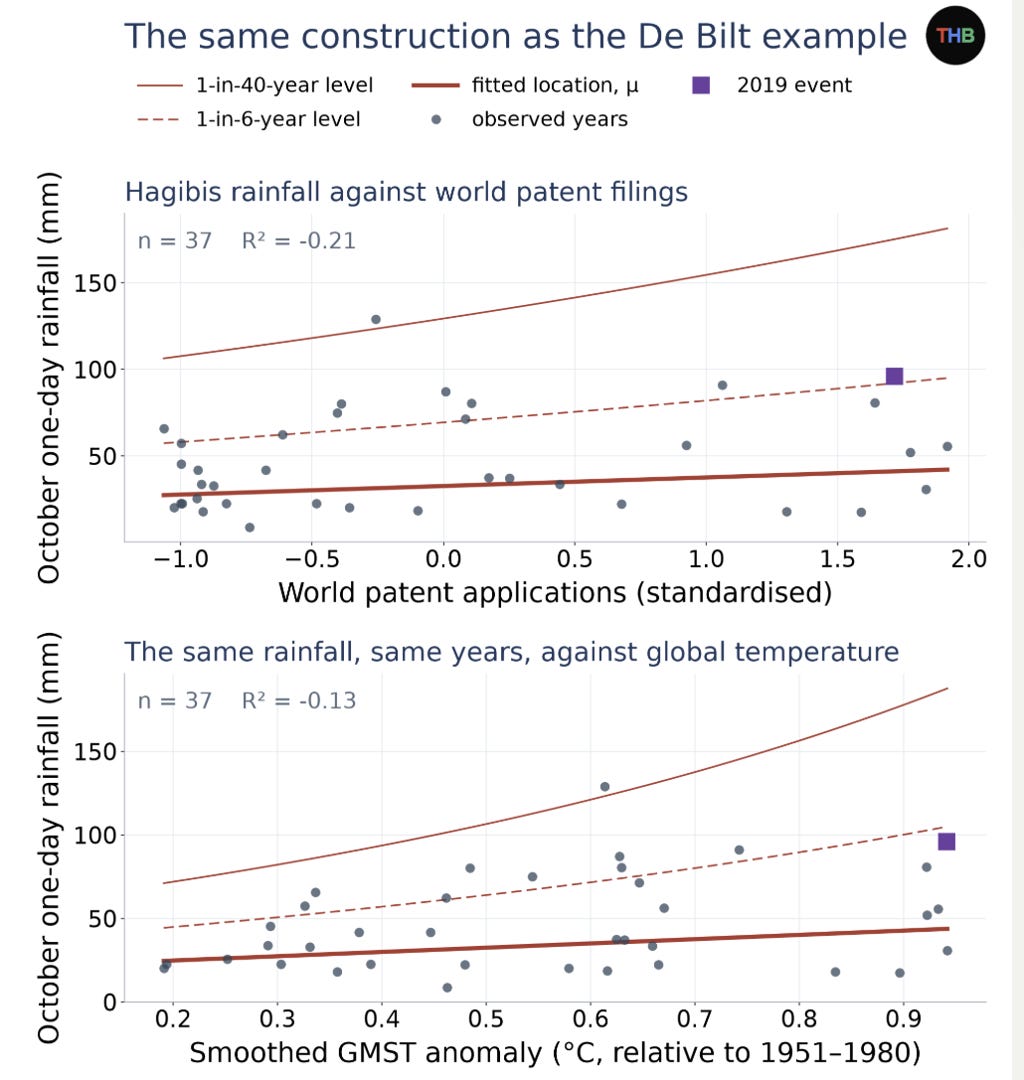
I replicated the 2022 WWA EEA study on the impacts of Typhoon Hagibis in Japan in 2019. I then redid their study using global patent applications in the place of GMST.
The figure below shows a correlation between patent applications and one-day October rainfall in the region that experienced the flooding. That relationship gives me what I need to create return periods for extreme rainfall in the patent worlds of 1985 and 2019.
Next, the figure below shows how patent change has resulted in greater one-day rainfall in October in this region of Japan.
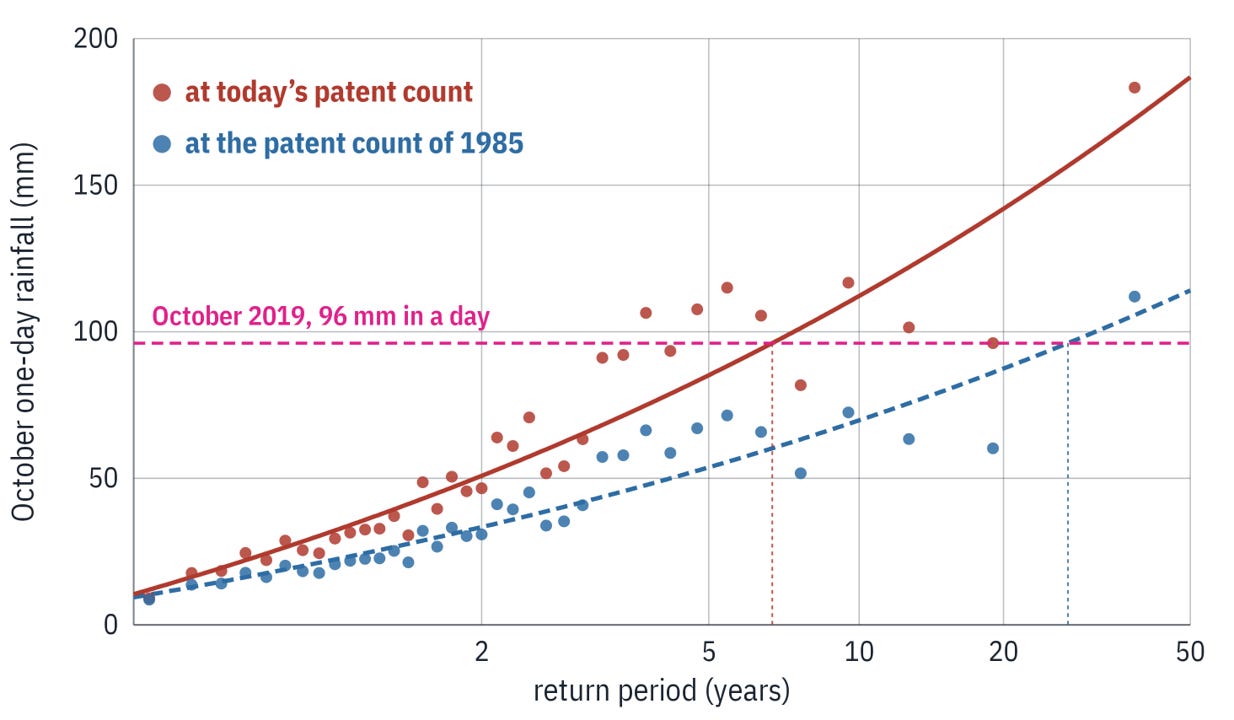
Just since 1985, increasing patent applications have made an event like Typhoon Higabis about 4x more likely — what was once about a once-in-28-year event today occurs once every 7 years. Until the world agrees to reduce patent applications, risks of such events will continue to rise.
Again, we can swap out any variable we want for patent applications, and so long as it has a trend, we can attribute any other variable with a trend to it — rainfall, home runs, you name it.
An Inkblot Test
This brings us back to where this post started. If you are among the people who already believe that “climate change” is making extreme weather worse — the “persuaded” in the bar chart up above — then WWA press releases and technical documents will confirm what you already believe.
If you are skeptical of the notion that “climate change” makes individual weather events more likely or intense, there is no science within the WWA corpus that can convince you — because WWA never engages in any formal attribution analysis. As I documented above, under the WWA methodology attribution is assumed. In fact, EEA is not even scientifically possible.
WWA press releases generate a worldwide publicity blitz crediting WWA with findings that their methods cannot produce — demonstrate the single cause of particular weather event. What WWA is doing instead is seeking to manage collective attitudes by manipulating symbols.
Propaganda in short.
If WWA were just some backwater effort, none of this attention would be warranted. However, WWA has become so influential that it is threatening to displace or subsume legitimate climate science related to the detection and attribution of extreme events. In the process, EEA adherents and fellow travelers in the climate advocacy ecosystem are also corrupting authoritative institutions of science that are supposed to call things straight rather than emulate climate advocacy organizations.
Consider the recent report of the U.S. National Academy of Sciences (NAS) on extreme event attribution (which is problematic for many reasons). The table below shows who the report cites the most. Perhaps unsurprisingly, the Bezos Earth Fund underwrites both WWA and the committee that wrote the NAS report. Small world.
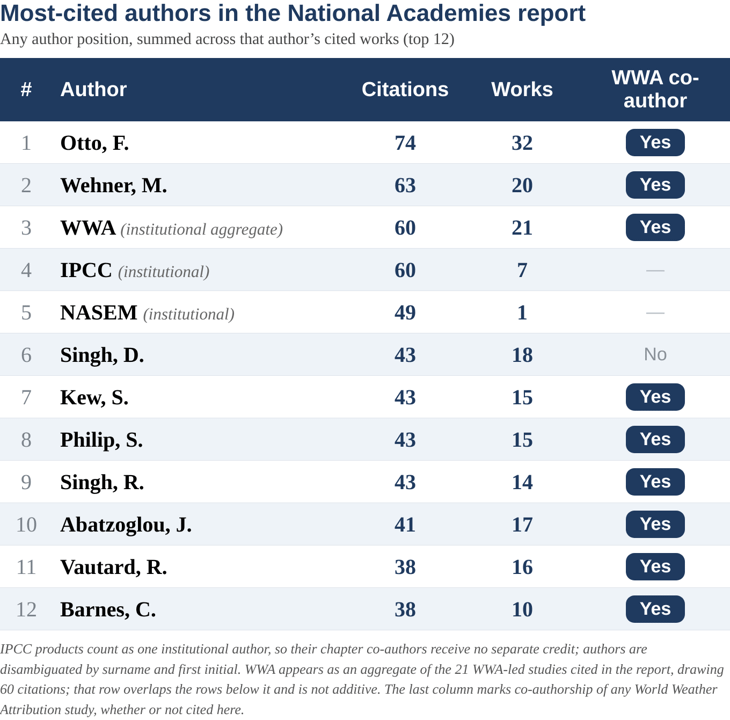
Similarly, the IPCC AR7 chapter on extreme events includes two people from WWA among the 20 co-authors — with 9 members of the writing team specializing in EEA. Friederike Otto is a chapter co-lead (and also at the top of the table above).
As I’ve often explained, humans affect the climate system, posing real risks for the future that call for smart and pragmatic mitigation and adaptation policies. Climate change is not so important that it justifies compromising scientific integrity or the institutions that assess and advise where science meets policy.
Let’s get this post some readers — Please click that “❤️ Like” button.
Appreciated!
Comments welcomed!
Check the new THB Data Dashboards and Tools:
Decarbonization Around the World
US Extreme Weather and Climate Change
Global Extreme Weather and Climate Change Dashboard
THB Build Your Own Climate Scenario Tool
and the new
And there is lots more to come
Thank you!
The WWA group use the Generalized Extreme Value distribution to characterize annual maxima. They estimate a "nonstationarity" parameter (the coefficient tying the center of the distribution to global avg temp) using maximum likelihood. Use of GEV adds a layer of opacity to what they are doing but in the data I've worked with you get pretty much the same results (in terms of finding statistical significance) just using ordinary regression, which is more transparent and has a lot of tools available for specification testing and for correcting things like serial correlation, omitted variables bias and spatial dependence.
The WWA people also stack the deck by constructing their counterfactual climate using a model like FaIR in which CO2 is the only thing that changes the climate. So they use smoothed global mean temperature as the only explanatory variable to explain any change in the annual extreme value, and then they construct a counterfactual return period using a model in which only CO2 changes temperature. So it's a closed loop that can only ever tie extreme weather events to CO2. It's pretty pathetic but obviously impresses the heck out of the editors of Nature journals.
Whatever happened to the old "correlation is not causation" we learned in science school. Has that been formally overturned? But even Wikipedia has an entry on it.https://en.wikipedia.org/wiki/Correlation_does_not_imply_causation
So we are supposed to believe correlation does not imply causation except in the case of climate change?