Special Report: Hurricane Ida in Historical Context
How much damage would past major hurricanes cause if they made landfall near New Orleans today?
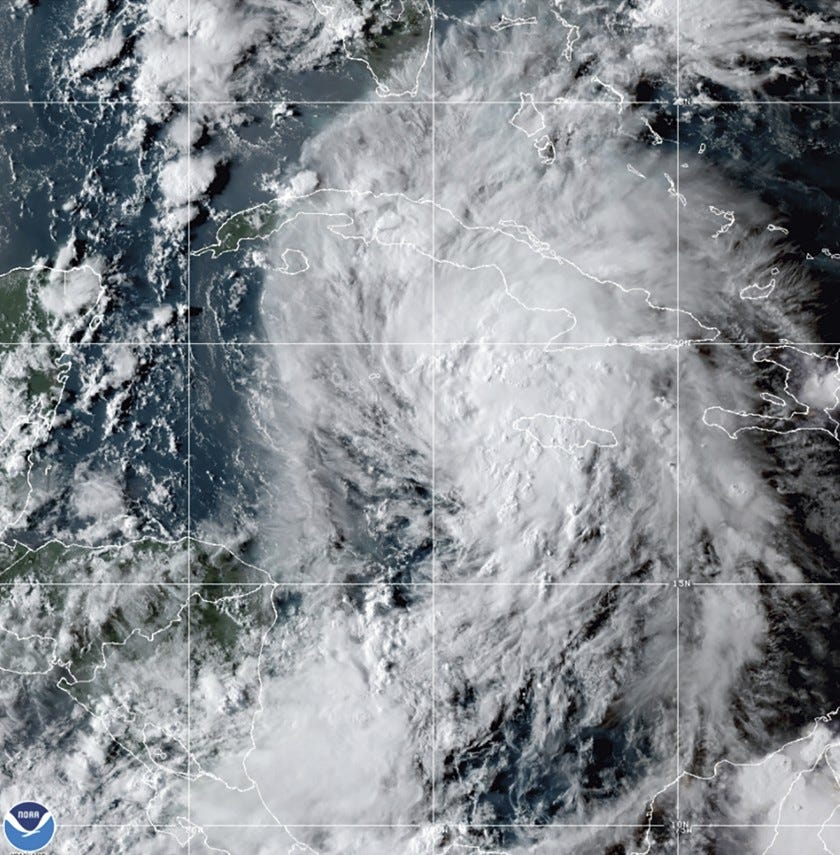
As I write this, Hurricane Ida is barreling towards Louisiana, and is expected to make landfall as a Saffir/Simpson Category 4 storm. For those looking for real-time storm information, head over the the U.S. National Hurricane Center.
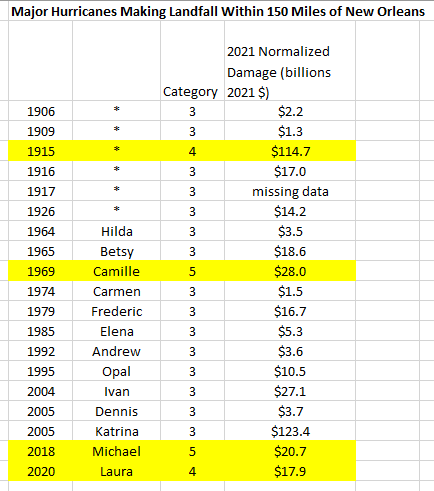
In this post I share information on past major (Category 3+) hurricanes that have made landfall within 150 miles of New Orleans, and in particular an updated estimate of how much damage each of those storms would have caused were they to occur today, based on our research. I also provide some time series of landfalling hurricanes of various strengths for the U.S. and globally, and end with data on global hurricane activity.
According to NOAA, 19 major hurricanes have made landfall within 150 miles of New Orleans from 1900 to 2020, with their tracks shown below. Louisiana is no stranger to hurricanes.
The table below lists those hurricanes (updated from Weinkle et al. 2018), their names (note that the first 6 entries were unnamed), their S/S category at landfall, and an updated estimate of how much damage each would cause were it to make landfall today - called “normalized damage.” Category 4 and 5 storm are highlighted in yellow.
One thing to take from this data is the enormous variability in normalized losses for storms of the same category. Katrina was the most costly and was a Category 3 at landfall. This variability highlights the importance of the hurricane track in relation to where people and property are located. The two strongest storms at landfall — Camille and Michael — made landfall in less populated areas, and thus have considerably less damage than they would have had they directly hit a more populated region.
It is far too early to make specific estimates of Ida’s likely damage, but based on historical analogues losses in at least the multiple tens of billions of dollars would be expected for any storm making landfall at Category 4 or 5 strength in this region. More precise estimates will need to await further information.
Below is a table of the top 25 most costly hurricanes, normalized to 2021 values, again, updating the analysis of Weinkle et al. 2018. Ida is poised to break into the top 25
For those looking for broader context on landfalling hurricanes, the following three graphs on trends in US landfalling hurricanes are updated from Klotzbach et al. 2018. The first shows CONUS landfalling Category 4 and 5 storms 1900 to 2020, the second landfalling major hurricanes (Category 3+) and the third shows all landfalling hurricanes (Category 1+).
And for those interested in even broader global context, here is a time series of global landfalls at hurricane and major hurricane strength, 1970 to 2020, updated Weinkle et al. 2012. This post goes into even more detail and extends that time series back in time.
And finally, for those who want an even broader global picture, via Ryan Maue, the graph below shows global hurricane and major activity from 1980 to present.


Other important context is a $15 billion seawall system around the area, completed by Army Corps around ~2016; should dampen wave action, prevent some levies from failing, and associated water damage.
Roger....size is also important and the eye of Ida is quite small.....a good thing..cliff mass