More Good News From the Most Recent Climate Scenarios
A quick summary of my talk today at the IIASA Scenarios Forum
Today I had the pleasure to speak at the International Institute for Applied Systems Analysis (IIASA, pronounced “ee-asa”) 2022 Scenarios Forum in Laxenburg, Austria, just south of Vienna. My talk reviewed recent work I’ve done with uber-collaborators Justin Ritchie and Matt Burgess. In this post I’ll give a quick overview of my talk, and for paid subscribers I’ll preview the new work in progress and bottom-line conclusions.
Here is a picture of me speaking today.
In my talk, I discussed scenarios of the future used by the Intergovernmental Panel on Climate Change (IPCC). We have developed a methodology that can be used to distinguish plausible scenarios of the future from those that are implausible. If we want to make smart policies about climate change, being able to make such a distinction is essential.
The image below shows a “cone” of possible futures, starting with today, indicating that the set of plausible futures is a subset of those that are possible. For instance, it is certainly possible that I will win the lottery, but it is definitely not a plausible future.
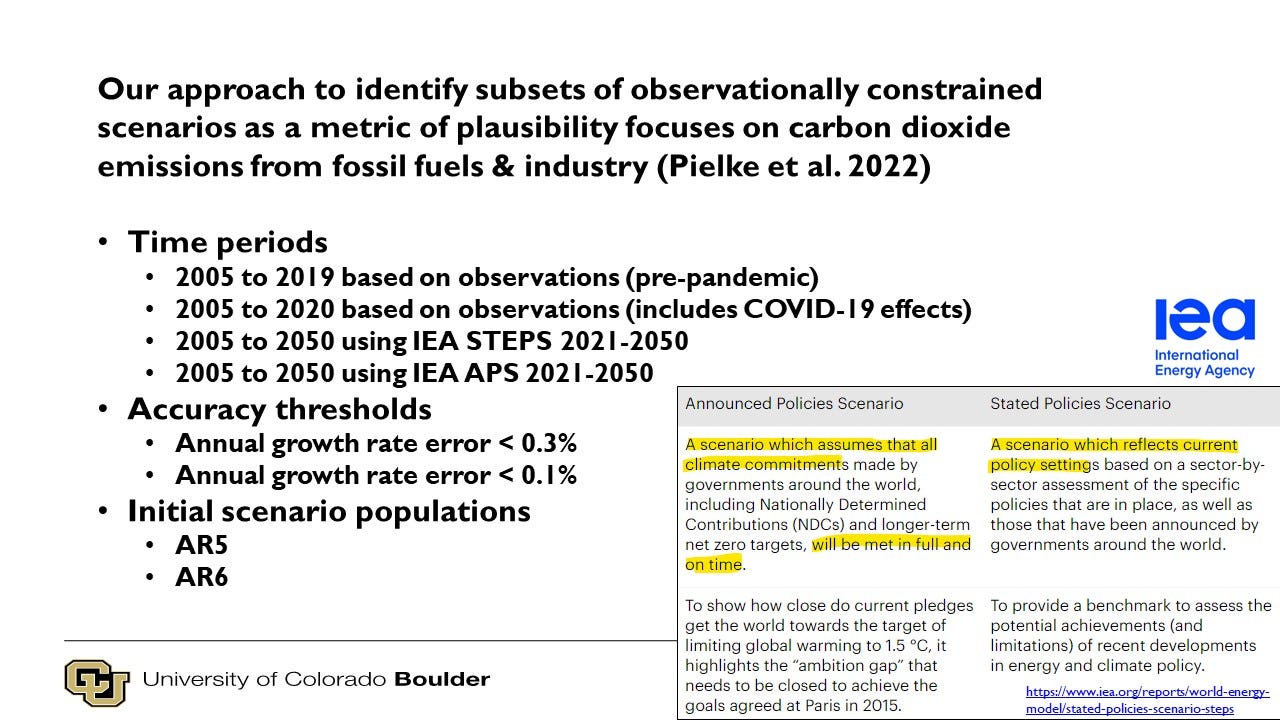
Our recent research has used historical data on carbon dioxide emissions for fossil fuels and industry, plus near-term projections of the International Energy Agency (IEA), to identify those scenarios of the IPCC that match up with what actually happened and what is projected to happen. The IPCC uses a very similar approach to evaluate earth system climate models — by prioritizing those that can best match what has actually been observed. The exact details are not so important, but the following slide shows how we screened IPCC scenarios (and please read our papers, listed at the end, for all the technical details).
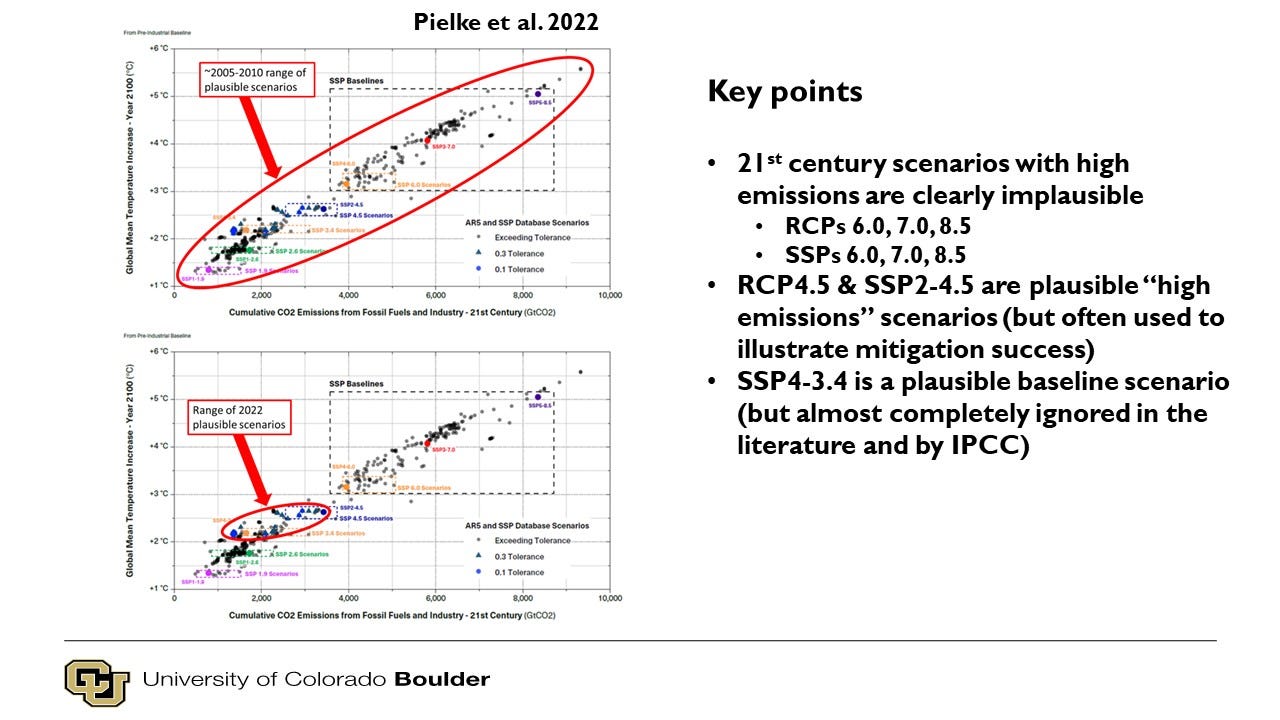
Our results are pretty amazing. The slide below shows at top, within the red oval, the entire set of the IPCC scenarios from its 2014 assessment report, with global average temperature change in 2100 on the vertical axis and cumulative carbon dioxide emissions from fossil fuels and industry on the horizontal axis. By definition, in 2014 all of these scenarios were deemed plausible, by the fact they were entered into the IPCC database.
At the bottom, the slide shows in the much smaller red oval the subset of scenarios that meet our test for plausibility. They all fall between 2 and 3 degrees Celsius by 2100. Of course, this is not success according to the criteria of the Paris Agreement, but it is not 4 or 5 degrees C either. I considered here how a time traveler from 20 years ago might have viewed these results.
One of the things I discussed today was how climate research and assessment has focused disproportionately on scenarios that our methods deem implausible. You can read more about that here. I noted with interest this evening how one of the Scenarios Forum keynote speakers complained about the pathological influence of climate modeling on scenarios research and use.
Below is what I presented about our latest research, focused on the recent 6th Assessment report (AR6) of he IPCC, as well as the bottom-line conclusions to my talk.
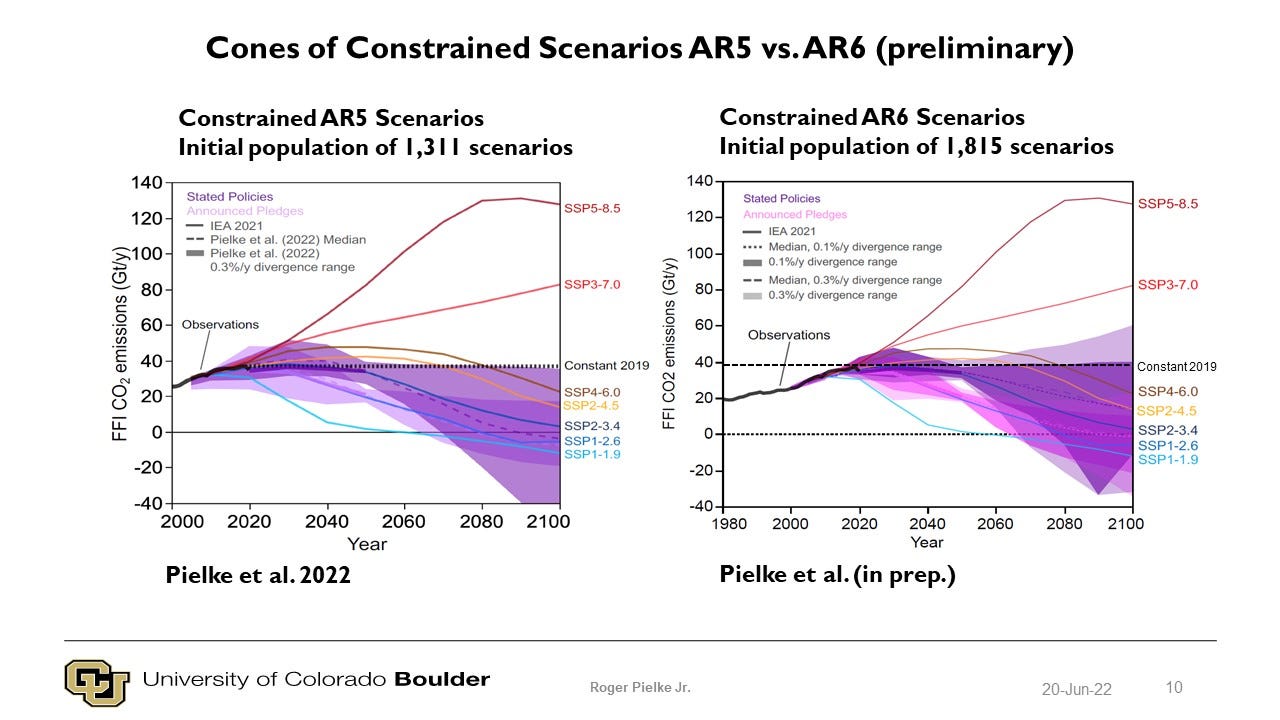
We have applied the methods of Pielke et al. 2022 to the scenarios of IPCC AR6 report. The results are quite similar to what we found with the AR5 scenarios, as shown in the figure below. Don’t mind the technical details — the purple cones in each each graph are remarkably similar. And that is good news for climate policy.
The figure below shows more precisely what we found for each of our plausibility screens. Of note is that emissions trajectories most closely aligned with the IEA Announced Polices Scenario (APS) achieve climate policy success — projected global average temperature change of less than 2C and towards 1.5C. That suggests that climate mitigation policy success is not guaranteed, but certainly plausible.
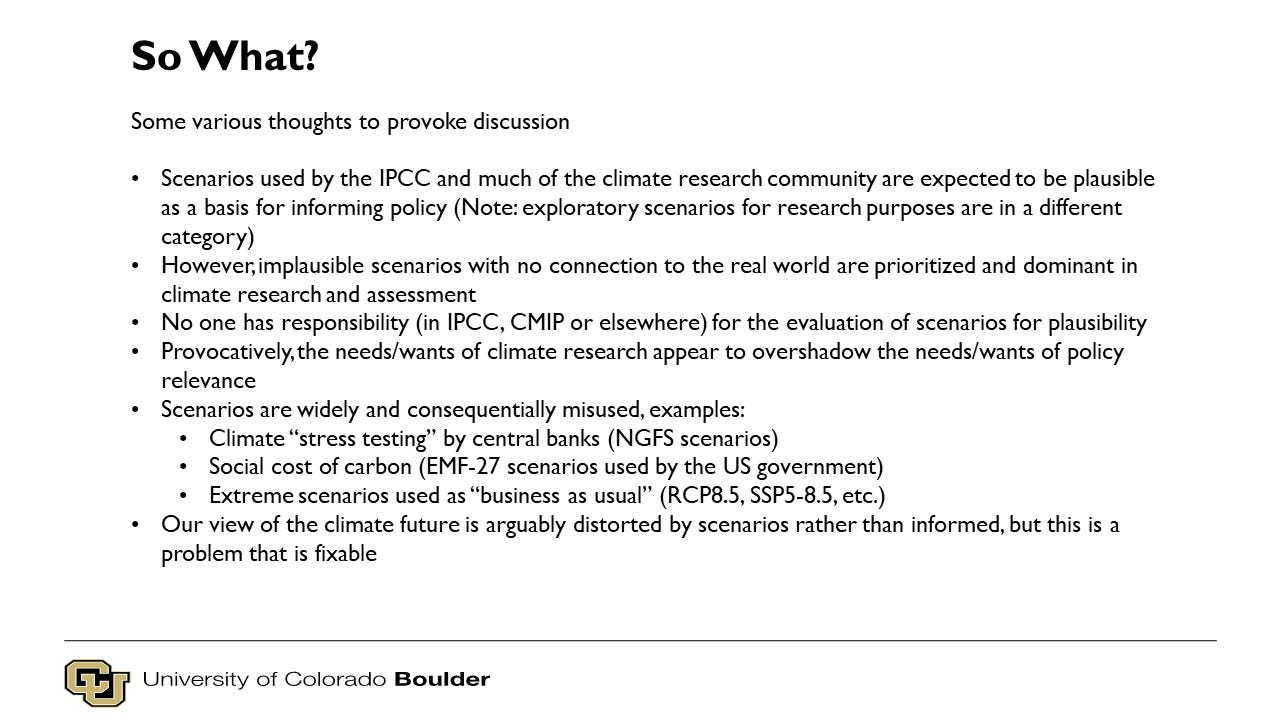
In my talk I answered the question: So What? Here is how I answered that question:
More generally, I ended my talk today with a note of optimism, quoting from our recent paper:
“Deep decarbonization remains an enormous challenge, and net-zero CO2 emissions by 2050—a common policy goal—remains outside the envelope of even the plausible scenario trajectories. Of course, decision makers around the world could choose to intentionally grow CO2 emissions, but that currently seems highly unlikely based on analyses such as the UNEP (2021) Emission Gap report. Our analysis suggests that the world thus sits in an enviable position to take on the challenge of deep decarbonization, at least as compared to where IPCC baseline scenarios and some of the public discourse projected the world to be in 2021 (Pielke and Ritchie 2021a). To support continued efforts to achieve deep decarbonization, climate research and policy depend on the development and regular update of plausible scenarios.”
For further reading:
Ritchie, J., & Dowlatabadi, H. (2017). Why do climate change scenarios return to coal? Energy, 140:1276-1291.
Pielke, Jr., R. (2018). Opening up the climate policy envelope. Issues in Science and Technology, 34:30-36.
Burgess, M. G., Ritchie, J., Shapland, J., & Pielke, Jr., R. (2020). IPCC baseline scenarios have over-projected CO2 emissions and economic growth. Environmental Research Letters, 16(1), 014016.
Pielke Jr, R., & Ritchie, J. (2021). Distorting the view of our climate future: The misuse and abuse of climate pathways and scenarios. Energy Research & Social Science, 72, 101890.
Pielke Jr, R., & Ritchie, J. (2021). How Climate Scenarios Lost Touch With Reality. Issues in Science and Technology, 37(4), 74-83.
Pielke Jr, R., Burgess, M. G., & Ritchie, J. (2022). Plausible 2005-2050 emissions scenarios project between 2 and 3 degrees C of warming by 2100. Environmental Research Letters.
Pielke Jr, R., Burgess, M. G., & Ritchie, J. (in prep.). Constrained AR6 emissions scenarios highlight plausible paths to climate policy success.


