



Over the past year or so, I’ve invested a lot of effort into learning how to apply AI tools in my research. I’ve become somewhat skilled in using the tools.1
For instance, so far this year, I created four data dashboards:
The US Extreme Weather and Climate Change Dashboard — 39 variables across 8 phenomena, from NCEI, SPC, USGS, the US Drought Monitor, MTBS and NIFC.
The Global Extreme Weather and Climate Change Dashboard — 393 indicators from 71 variables across 8 phenomena, covering the entire world and every continent, with loss and mortality series from EM-DAT via Our World in Data.
Decarbonization Around the World — carbon intensity of GDP by country and region, 1965 to 2025, on the Energy Institute Statistical Review, with a calculator for converting emissions targets into nuclear plants and wind turbines.
Global Tropical Cyclones, with Ryan Maue, utilizing the IBTrACS best-track archive.
The sites have drawn enormous traffic and spurred a lot of interest.
This week I’ll be releasing another major new website, titled the THB Build Your Own Emissions Scenario. It will allow users to create bespoke climate scenarios for direct comparison with the new CMIP7 scenarios. It is fantastic, if I say so myself!
Recently, I asked Claude to price the four public dashboards as a conventional project: hire a team with the required expertise at 2026 rates, allow no AI assistance, and produce exactly the same dashboards that I’ve produced using AI tools. Claude’s answer to that question can be seen in the table below.
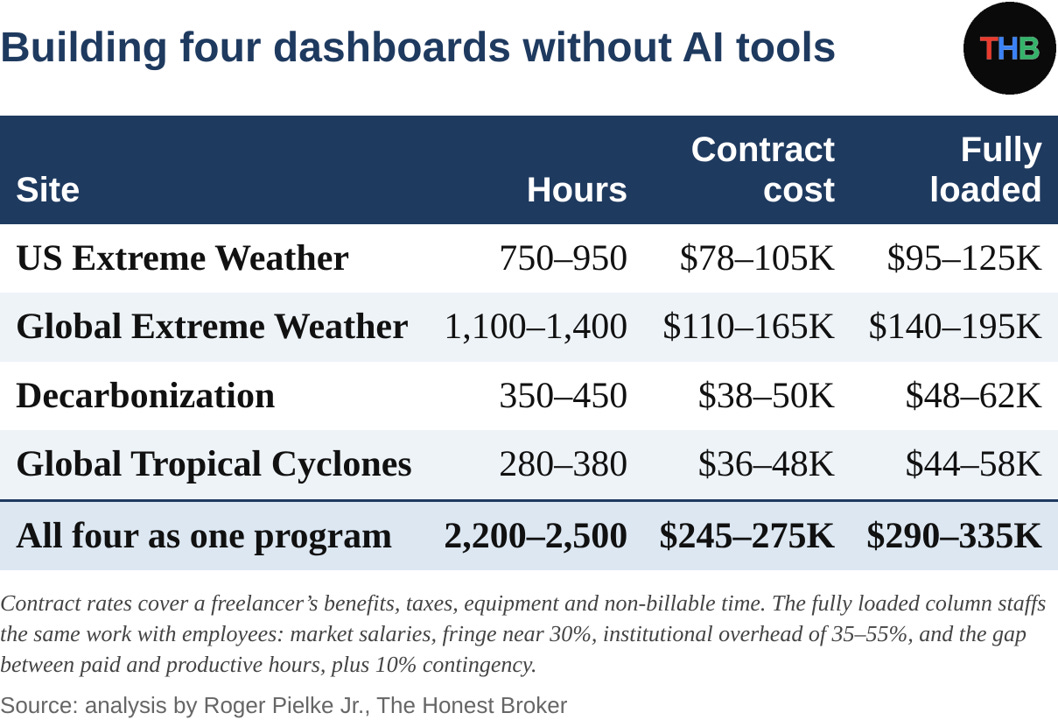
Coding takes up just under half of the hours. For the Global Extreme Weather site, here is how Claude breaks down the equivalent human coding effort:
500–650 hours for the code alone — roughly three to four months of full-time work for one experienced developer, assuming a data-driven architecture where 393 indicator views render from configuration rather than from 393 hand-built pages.
Where those hours go:
Ingest and transform pipeline, 120–160 h. Readers for a dozen source formats, a common schema, continent aggregation, and the build step.
Statistics module, 40–60 h. Mann-Kendall, Sen’s slope, the magnitude criterion, plus tests against known cases.
Front end, 200–260 h. The charts, phenomenon and continent navigation, detection verdicts, per-chart data and figure downloads, user options.
Static pages, 50–70 h. Detection and attribution comparison, the normalization study table, methods, sources.
Performance, deployment, cross-browser and mobile QA, 60–80 h. Hundreds of series in one site create load and caching problems that need significant debugging.
The coding capabilities of AI are — what words to use here? — an absolute game changer for research and the communication of research results.
How much did these sites actually cost using AI tools?
My estimate is that all four sites cost less than $10,000, for hardware, subscriptions to AI tools, various other subscriptions like hosting — all underwritten by THB paid subscribers, thank you! That estimate does not count my time (AEI pays me a salary, thanks AEI!) or my expertise (priceless really;-).
I created all four sites (with GTC a collaboration with Ryan Maue) over a period of months. I hope that this illustrates how significant the application of AI tools can be for research and communication.
What if I did these projects at a university?
For most of my career I had only one route available to perform work at this scale: write a federal proposal, wait, and hope it gets funded. Over my career at the National Center for Atmospheric Research and the University of Colorado Boulder I was fortunate to have received millions of dollars in federal support for my work. I am proud of all that work and believe that I and my colleagues delivered great value in our work to the U.S. taxpayers whose earnings supported our research.
But AI tools have changed everything.
Let’s take a look at what it would have taken at my university to produce the four dashboards, based on my experience writing, winning, and executing many federal grants over the decades.
First, let’s look at the timeline, assuming that I would submit the grants for each site in sequence and that they would all eventually be funded — I had a great grant success rate, but nowhere near 100%. It is no exaggeration to conclude that producing the Global Extreme Weather site would take 3-4 years under the conventional approach to university research that I followed for decades.
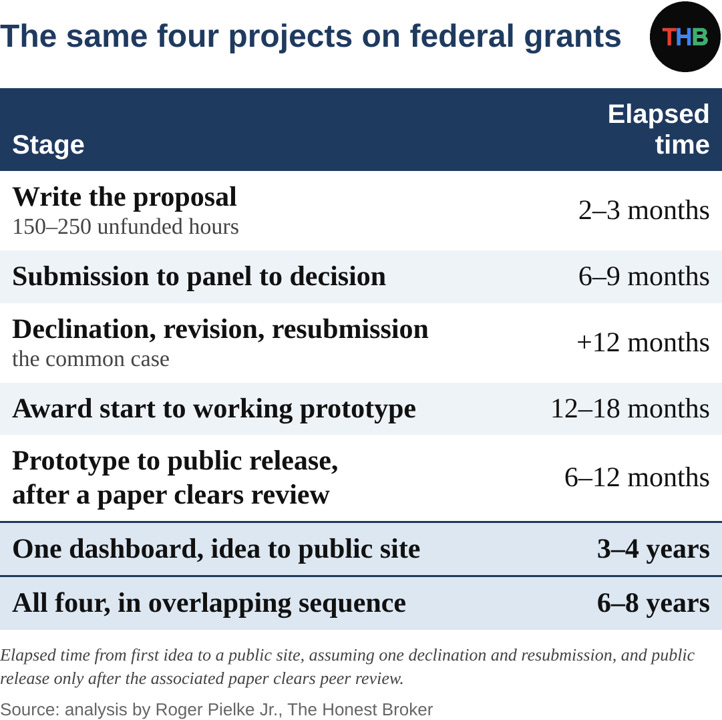
I am not at all critical of the conventional approach. That’s how things were done because we had no other choice. Proposal preparation, evaluation, award management, recruitment, hiring, training all take time — and that’s before the research and implementation even begins.
That conventional approach resulted in all of the advances in science and technology that we have achieved in the post-World War 2 era, up until the invention of AI tools. It is quite a track record.
But now everything has changed.
Let’s next look at the estimated costs of developing my dashboards at a university: Each award would include a postdoc, a graduate research assistant, a slice of the faculty member’s summer salary and travel, along with benefits — and CU Boulder charges a federally negotiated indirect rate of 57.5 percent on top. All of these are realistic assumptions.
The table below shows the estimated costs.
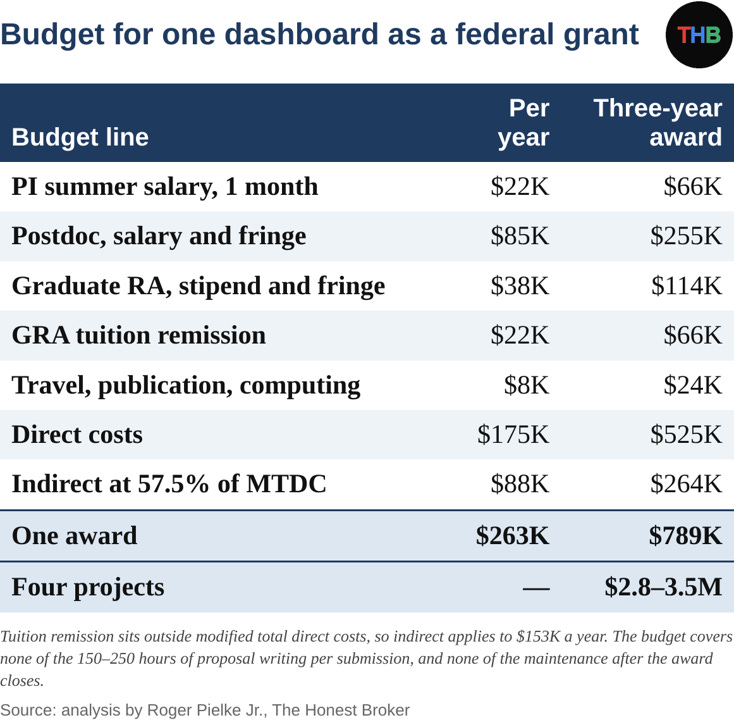
What I’ve produced this year would have cost the taxpayer about $3 million and taken the better part of a decade. Instead, THB subscribers who see value in my work have underwritten the work, and given me the opportunity to explore a new model for doing my research.
There are plenty of complexities here that will be worth exploring in future posts. For instance, I could not do what I have done without my 30+ years in public research institutions and the federal support that gave me the knowledge and expertise necessary to do what I do.
Also, critically, most PhDs earn that PhD with federal support to work on faculty research projects (my PhD was not on a federal grant, I was a teaching assistant).
If AI shrinks the grant-funded research workforce, the institutional ecosystem that produced people like me will no longer generate expertise at scale — we will need a replacement. Where is such expertise going to come from in the AI era?
Research
AI tools allow me to take on research that in the past I would only have dreamed about. Our 1999 paper — with Ken Kunkel and Stan Changnon — on trends in weather extremes in the United States took several years to prepare, write, and get published. It was a great paper and has been widely cited. Now I can do that same analysis — and much more — in just a few months (or less) and produce a product that stays updated in perpetuity.
AI tools open up a universe of possibilities that will require me to rescale my thinking to be much more ambitious about what might be done. I am working on thinking bigger.
That 1999 paper was published in a peer-reviewed journal. The academic paper has been the standard unit of scientific production for generations. What happens to peer-reviewed papers in the age of AI tools which offer additional routes to conducting and sharing cutting edge work?
My extreme weather dashboards are based on official governmental data (thanks to taxpayers around the world) and analyses of these data by others in peer-reviewed papers. Could I write up a paper for publication on the dashboards and what they show? Sure. Will I? I doubt it. Why would I?
Peer reviewed papers will still be necessary, but AI tools open up new channels for performing and publishing high quality research. The scientific community will need to adapt accordingly.
Communication
For more than thirty years, I have written in public more-or-less every few days about what I’m working on, issues in science and policy, and my professional life. I’ve had some success sharing ideas, engaging others, and participating in science and policy debates.
But here as well, AI tools are revolutionary.
For instance, in the past I’d write a blog post about trends in U.S. hurricanes, and carefully describe the data and what it shows. Now I can point to my global extreme weather site that has up-to-date data on 393 different indicators of extreme weather around the world, evaluated according to IPCC criteria for detection, and incorporating the most recent peer-reviewed literature.
In the past, the media and authoritative climate assessments could (and usually did) ignore one-off blog posts based on official data and peer-reviewed research, including my own. The ability to construct what are in effect independent assessments of what available research and data say on a particular topic holds the potential to elevate public discussions of science and policy. At the same time, such independent assessments will challenge those who have used authoritative assessments to gatekeep knowledge or repurpose it to stealth advocacy.
AI tools change everything.
The importance of public data
All of my work depends upon data paid for by taxpayers — for instance, NOAA posts tornado records, NIFC acres burned, the Energy Institute the energy figures for every country. Each of us can download all of it today at no charge.
I cannot overstate the importance of government support for collecting and sharing the data upon which research depends. This goes for economics, public health, weather and climate, and far more.
AI tools mean that governments — and really, that means us taxpayers — should be investing much more into observations and data collection. The applications that we can put these data to are endless.
Better application of AI tools raise the return on every public dollar spent collecting data, so underinvestment in both data and its use now has opportunity costs today that are much higher than in the past.
The education problem
Universities have spent the past three years arguing about AI detection software and honor codes. I see on social media many academics and scientists complaining about the use of AI tools in research. Some even suggest that AI tools should be banned in research or in publishing.
That strikes me like arguing in the 1980s that spreadsheets or the use of FORTRAN should be banned. AI tools are exactly that — tools. Using a tool well requires skill and expertise.
That leads me to what I believe to be a much more fundamental question facing educators: Effective and productive use of AI tools requires much more than being conversant with AI tools. That’s the easy part.
Doing what I do is only possible because I have over many decades developed the expertise, wisdom, and judgment that is necessary to make good use of AI tools. For instance, when Ryan and I developed our Global Tropical Cyclones site, Ryan knew — and AI did not without Ryan’s prompting — that the JTWC record of past storms was incomplete prior to 1985 and we could recover additional useful data via the NCAR ds824 dataset.
It would have been easy to have produced a slick site, authoritative looking and reading, but based on an incomplete knowledge of the available data. Indeed, one of the biggest challenges in the work I do is steelmanning the outputs to make sure they are consistent with the best research and data available. Research remains imperfect even with AI tools at our disposal.
Training students to effectively use AI tools requires that they have a foundation of knowledge and skills that go well beyond that which AI can provide or substitute for. I developed my knowledge and skills with no AI tools available — in an analog world. At the same time, I developed pretty good knowledge and skills in mathematics (my undergraduate degree) in an era of computers and calculators that could do any applied math problem.
I have no easy answers, but I do know that university leaders should engage this very important conversation. Here at THB you can expect that conversation to continue along with a steady stream of new research and products that THB subscribers and new technology make possible.
Before you go — Tell people about THB by clicking that “❤️ Like” button.
Appreciated!
Comments and discussion welcomed
Check the new THB Data Dashboards:
Decarbonization Around the World
US Extreme Weather and Climate Change
Global Extreme Weather and Climate Change Dashboard
and the new
There is lots more to come
Thank you
Great work. I would add that AI makes it much easier for a knowledgeable individual to challenge the consensus in any field of intellectual inquiry.
Two of your statements immediately jumped out at me: "...I have over many decades developed the expertise, wisdom, and judgment that is necessary to make good use of AI tools..." and "one of the biggest challenges in the work I do is steelmanning the outputs to make sure they are consistent with the best research and data available."
One of the delights of retirement–from an academic career as a chemist and administrator–is the opportunity to pursue a wide variety of topics and, in those pursuits, draft introductory documents for the novice. Those have included a variety of topics including critical theory's influence on higher education, the paleogeology of the Rio Grande River in Big Bend National Park, and the role of fallibilism in emergence (in progress!). Some of these explorations were at the encouragement of friends and colleagues, and others were responding to my own long but frustrated desire to do so.
As you point out so well, I have found AI as a useful research companion, but only reliable if I first gain sufficient knowledge of the subject to avoid being misled by an occasional tendency of AI to favor the preponderance of information on one side of an issue or question. Related, but also important, is not being too explicitly demanding in a query...asking for alternate viewpoints is frequently necessary. Your "steelmanning" comment is crucial.
It's a great tool to explore with and it's fun to argue with...
Kudos on your dashboards...thank you!