


Global Weather and Climate Disasters 2000 to 2021
Graph of the Week #1

I’m starting a new feature at The Honest Broker Newsletter — a weekly graph from my work or the work of others that I think is worth sharing.
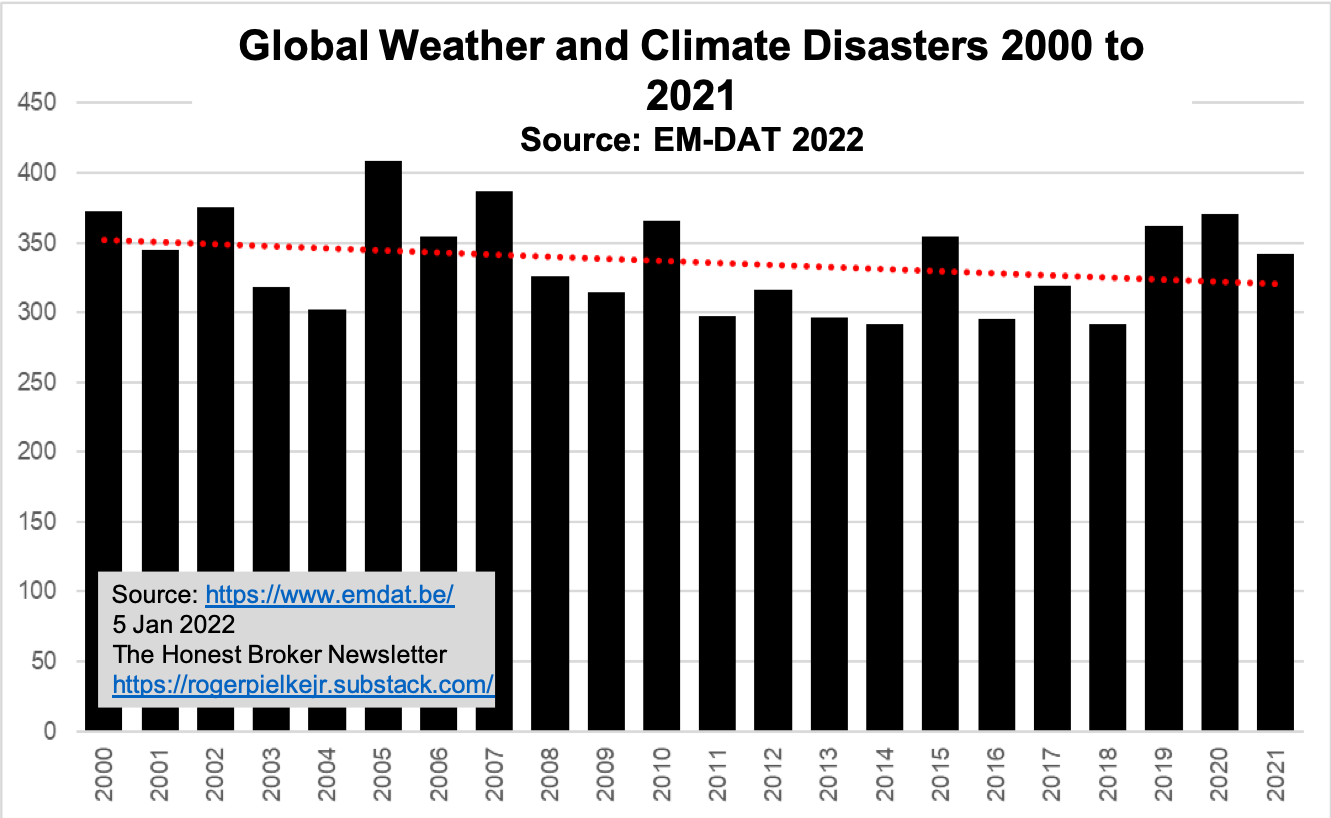
Today’s graph is based on data kept by EM-DAT in Belgium, which is widely viewed as an authoritative source for data on global disasters. The data show that from 2000 to 2021, the number of global weather and climate disasters declined by about 10%, which is very good news and completely contrary to conventional wisdom. The period since 2000 is viewed as the most reliable for data reliability, but it is safe to say that even since 2000, coverage has improved. So the 10% decline is possibly an underestimate. The trends reported here are consistent with independent, peer-reviewed research (e.g., this and this). Of course, don’t use data on disasters to say anything about changes in weather or climate — data on specific weather and climate variables are always more appropriate for tracking changes in climate.
Why don't we see this being reported by the BBC or mainstream papers? Or maybe the less naïve question is how do we get this sort of data into the mainstream media?
Dr. Pielke ==> You have used the EM-DAT data correctly. Data before 2000 in their database represents only the improvement in their data collection system and is not valid for comparison with post-2000 data. At least two major UN reports have knowingly misrepresented disaster by comparing decadal data before 2000 (1970s or 1980s) with decades after 2000, like 2010s.