The death toll from the Kahramanmaras earthquake has already reached 2,000 and tragically is certain to grow. In this post I share some information on trends in earthquakes and their impacts.
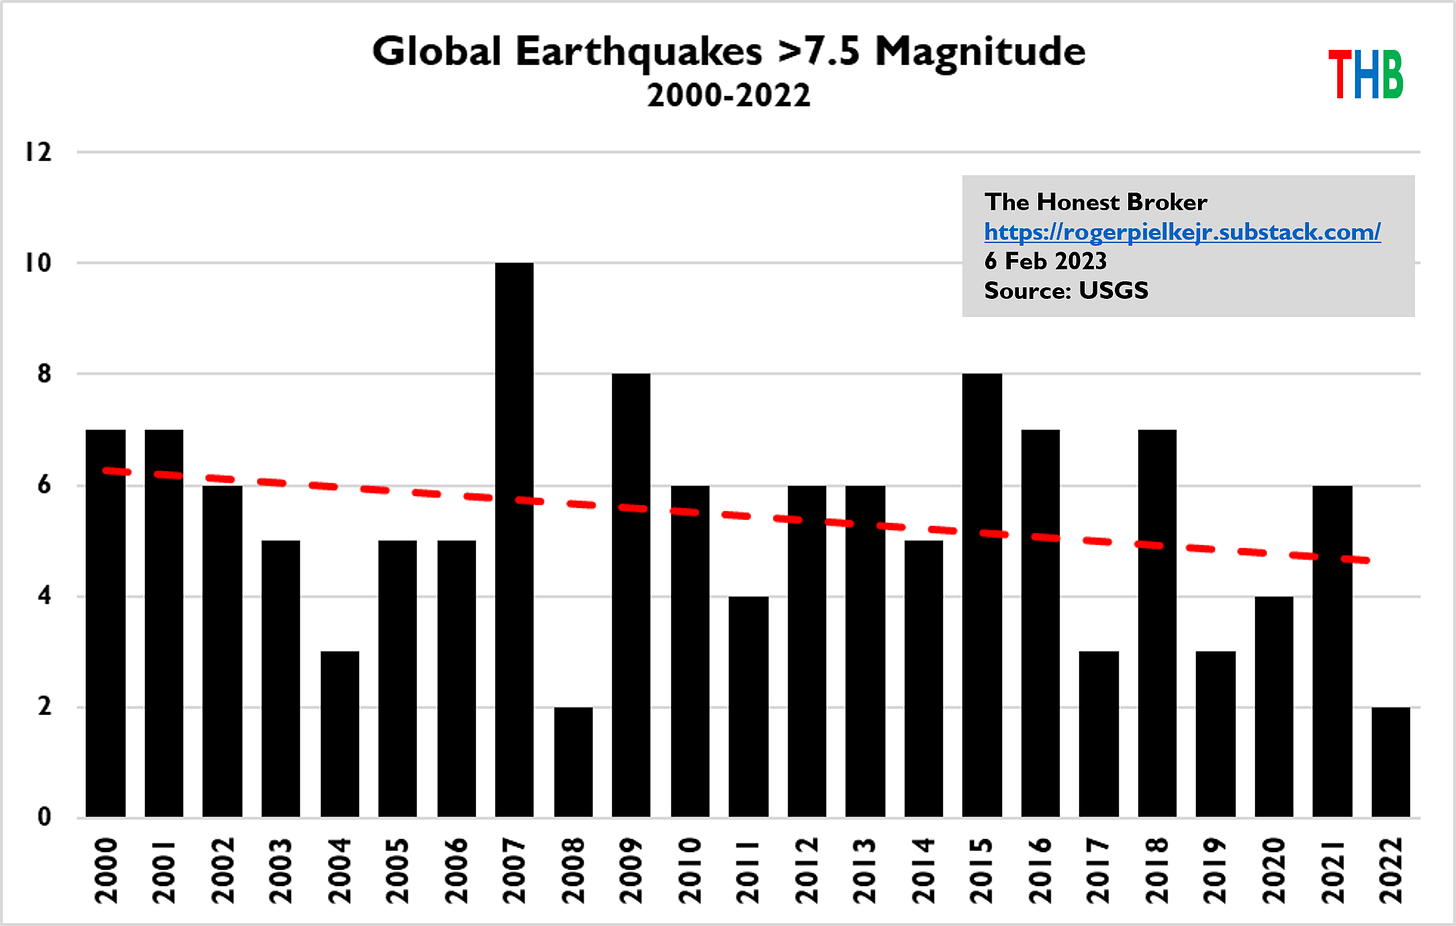
The figure below shows data from the U.S. Geological Survey for all earthquakes of magnitude 7.5 or greater since 2000. Over that period there was a decrease in these major earthquakes. Four of the past 6 years saw 4 or less magnitude 7.5 or greater earthquakes, while the previous 17 years before that only saw 3 such years. Of course impacts depend not just on how strong, but also where the earthquakes occur and the infrastructure of that region.
In the past day, there have been major two earthquakes in Turkey (initially reported as magnitudes 7.8 and 7.5), which means that 2023 has already seen 3 such quakes overall, which is more than the 2 observed in all of 2022.
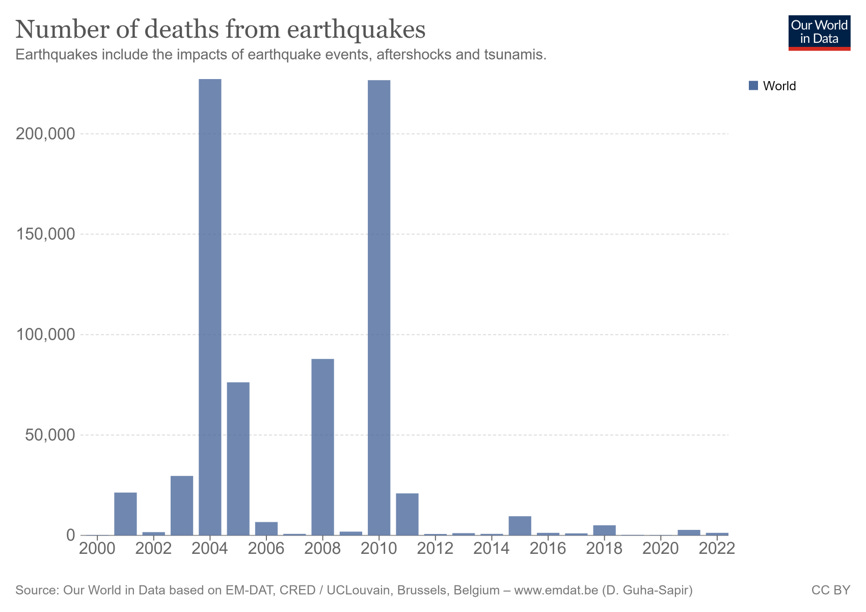
The figure below shows that the recent decade experienced far fewer deaths from earthquakes than did the first decade of the 21st century, which saw multiple high casualty events. Since 2000, earthquakes have been by far the disaster event responsible for the most deaths worldwide.
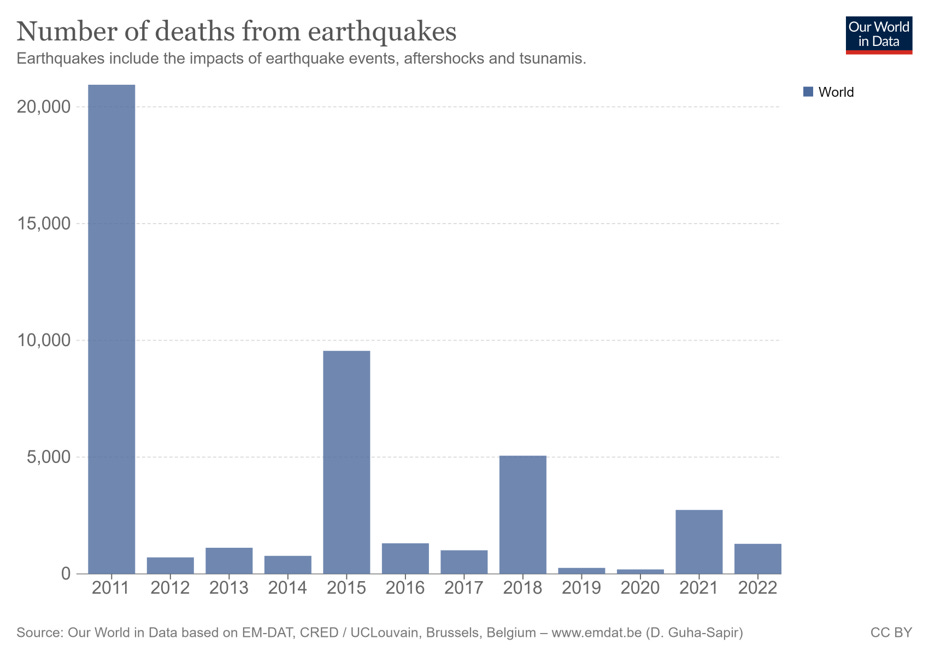
Even within the past decade recent years saw fewer deaths than from 2011 to 2015. The relative lack of major earthquake losses since 2019 is one factor that contributed to the past four years seeing the fewest deaths from disasters in perhaps all of human history.
Finally, the figure below from an excellent recent paper shows highlighted (by me) in yellow, trends in (a, left) fatalities as a proportion of exposed population and (b, right) economic losses as a proportion of exposed wealth. The authors note that the decrease in fatalities as a proportion of population began in about 1975 (noted by the red line I added), while the decrease in losses as a proportion of exposed wealth started in about 1995 (also noted by the red line I added).
One remarkable statistic from these data — of the 444 earthquakes in the database (covering 1967 to 2018), more than half of the total normalized economic losses resulted from just 8 earthquakes:
1976 (Tangshan earthquake China M = 7.6)
1980 (Irpinia earthquake Italy M = 6.9)
1994 (Northridge USA earthquake M = 6.7)
1995 (Kobe earthquake, Japan M = 7.2)
2008 (Sichuan earthquake China M = 8)
2010–2011 (including New-Zealand earthquakes sequences with M ranging from 5.3 to 7
2010 (Chile 2010 earthquake M 8.8)
2011 (Tohoku earthquake Japan M = 9.1)
For further reading:
Dollet, C., & Guéguen, P. (2022). Global occurrence models for human and economic losses due to earthquakes (1967–2018) considering exposed GDP and population. Natural Hazards, 110(1), 349-372.
Pielke, R., Catastrophes of the 21st Century (July 25, 2020). Available at SSRN: https://ssrn.com/abstract=3660542 or http://dx.doi.org/10.2139/ssrn.3660542
Vranes, K., & Pielke Jr, R. (2009). Normalized earthquake damage and fatalities in the United States: 1900–2005. Natural Hazards Review, 10(3), 84-101.


Excellent post, thank you. A question for you, or someone on the reading list. I've been reading lately about how the earth's core rotation rate has been slowing. Is it possible that the change in angular momentum caused by that action affects earthquake cycles on the surface? Further, is the change in rotational velocity cyclic, much like the differences in earth's rotation are explained by Milankovich cycles?
Fascinating. With the recent changes in Publix earthquake magnitude rating (moving away from the Richter scale and with the M equivalent) has the data from previous years been adjusted in historical archives?