Global decarbonization: How are we doing?
BP's annual energy statistics show insufficient progress toward net zero targets
Every summer, BP issues its Statistical Review of World Energy, which offers a detailed look at global energy production and consumption since 1965. For years, I have been using the Statistical Review to track progress on decarbonization of the global energy system. Tracking progress is straightforward, as achieving net-zero carbon dioxide requires that essentially all global energy consumption will need to come from carbon-free sources.
Some quick definitions before getting to the data:
Fossil fuels = coal, natural gas, oil
Carbon-free = Nuclear, hydro, wind, solar, other
Here are some highlights:
In 2021 global energy consumption hit a new record high, at 595 Exajoules (EJ)
In 2021 global carbon-free energy consumption hit a new record high, at 106 EJ
In 2021 global fossil fuel consumption was 2nd to 2019 (490.1 EJ) at 489.7 EJ
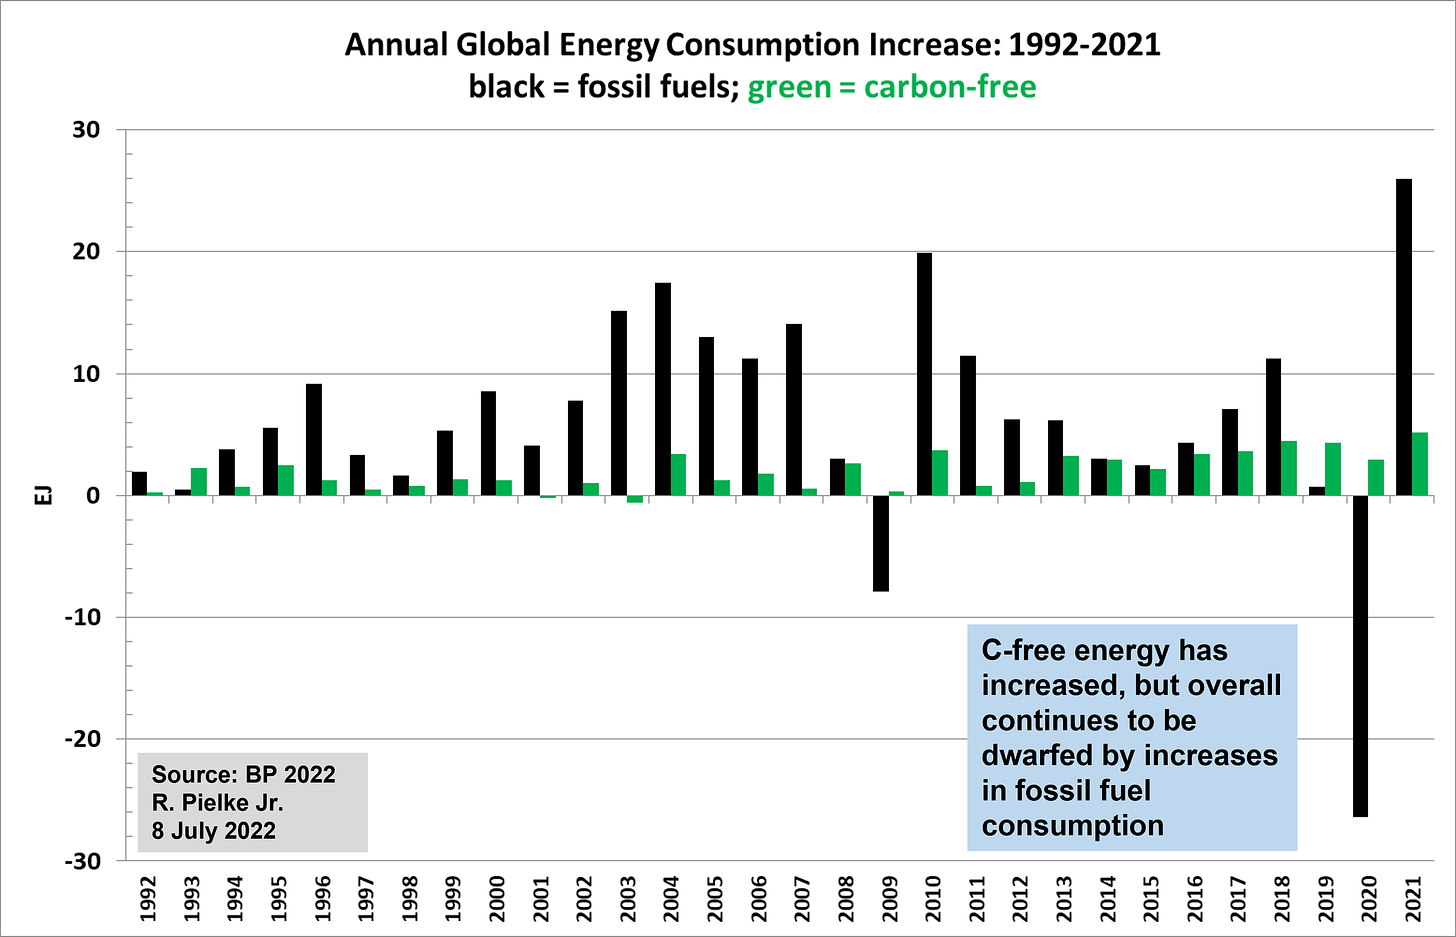
In 2020, global consumption of fossil fuels dropped by 26.4 EJ
In 2021, global consumption of fossil fuels increased by 26.0 EJ
In 2021 overall global energy consumption increased by 31.1 EJ, meaning that fossil fuels accounted for about 83% of that increase
Let’s now take a look at the data in graphical form.
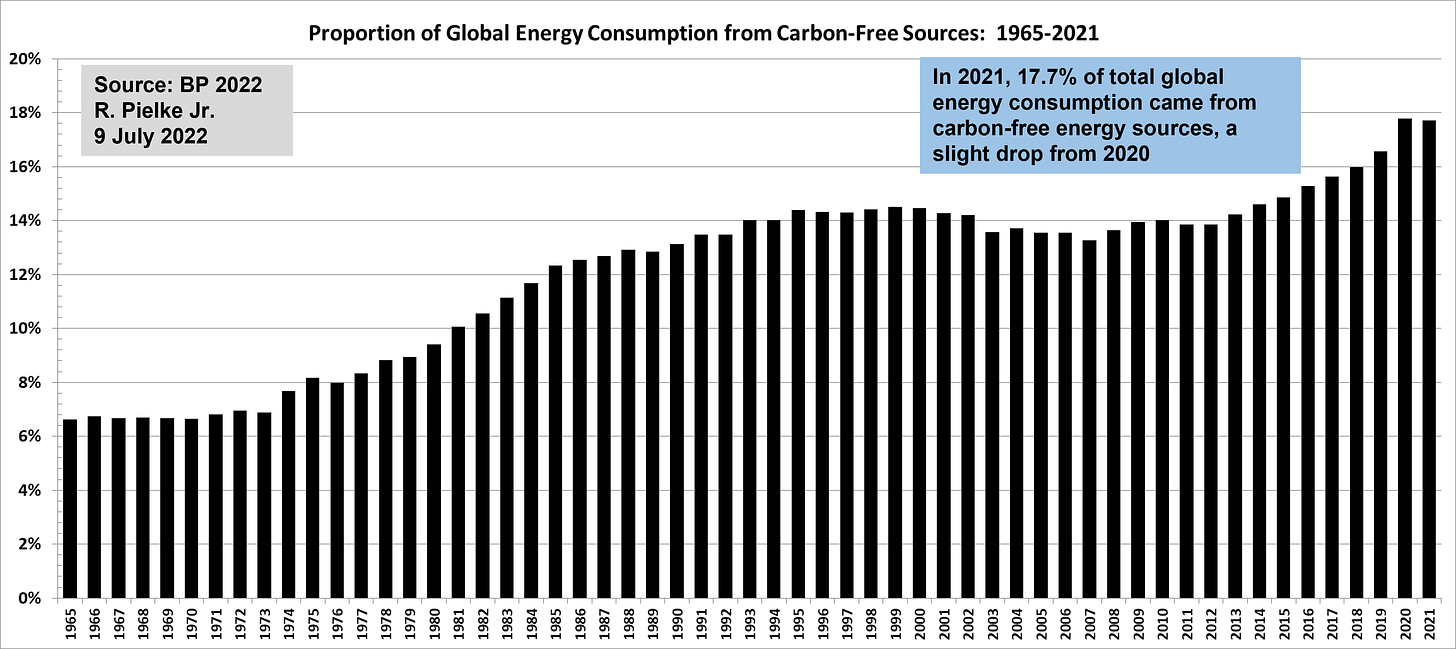
This first figure shows the proportion of global energy consumption that comes from carbon-free sources. There is some good news and some bad news here.
The good news is that carbon-free energy supply in 2021 was at a near-record, at 17.7% of total consumption. The bad news is that it dropped slightly from 2020 as the global economy roared back from the pandemic. As you can see the proportion of carbon-free energy didn’t start increasing until about 2013, and has increased fairly steadily since then.
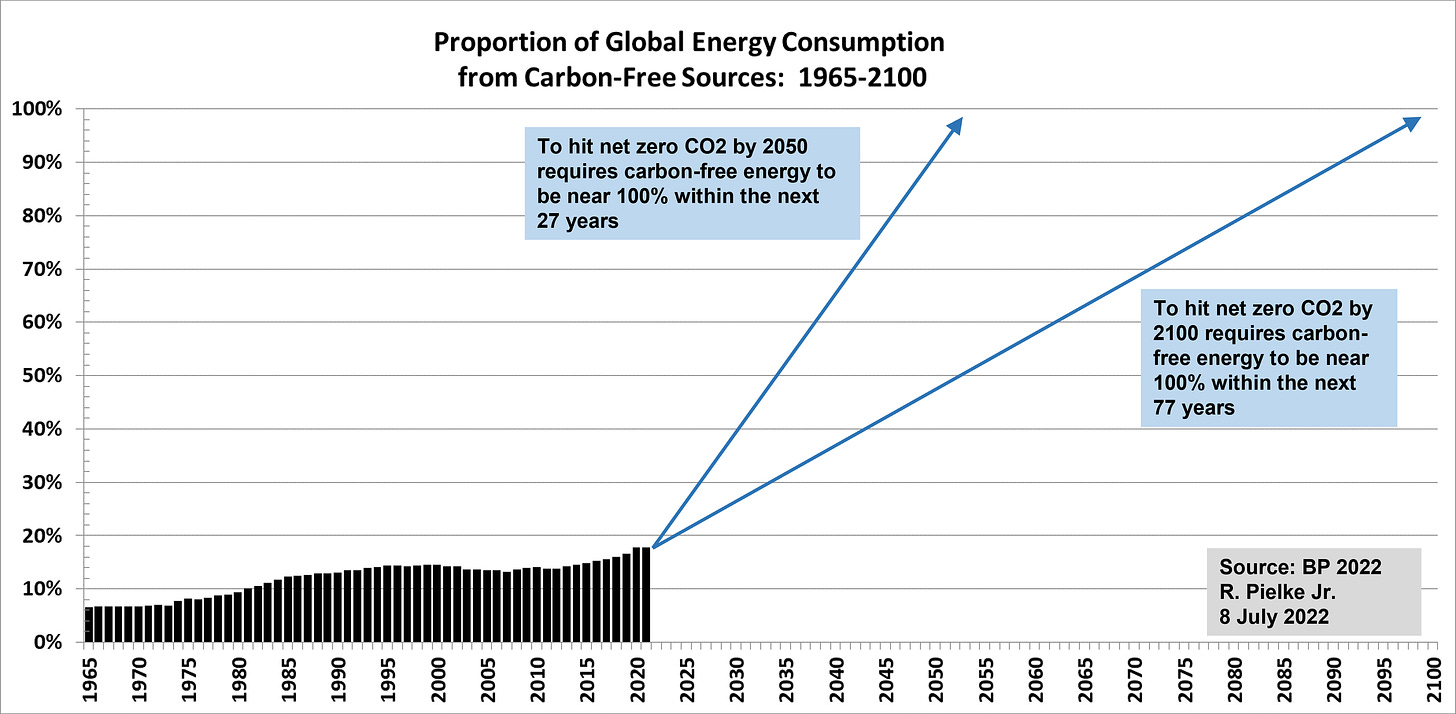
The next figure below shows how carbon-free energy consumption will have to grow as a proportion of total supply to hit net-zero targets for 2050 and 2100.
At the rate of growth in the proportion of carbon-free global energy consumption observed from 2015 to 2021, were that to continue, the world would hit net-zero carbon emissions from fossil fuels in 2197. That is obviously not close to 2100, much less 2050. The trend is in the right direction but needs to continue and accelerate to hit ambitious targets for transforming the global energy system.
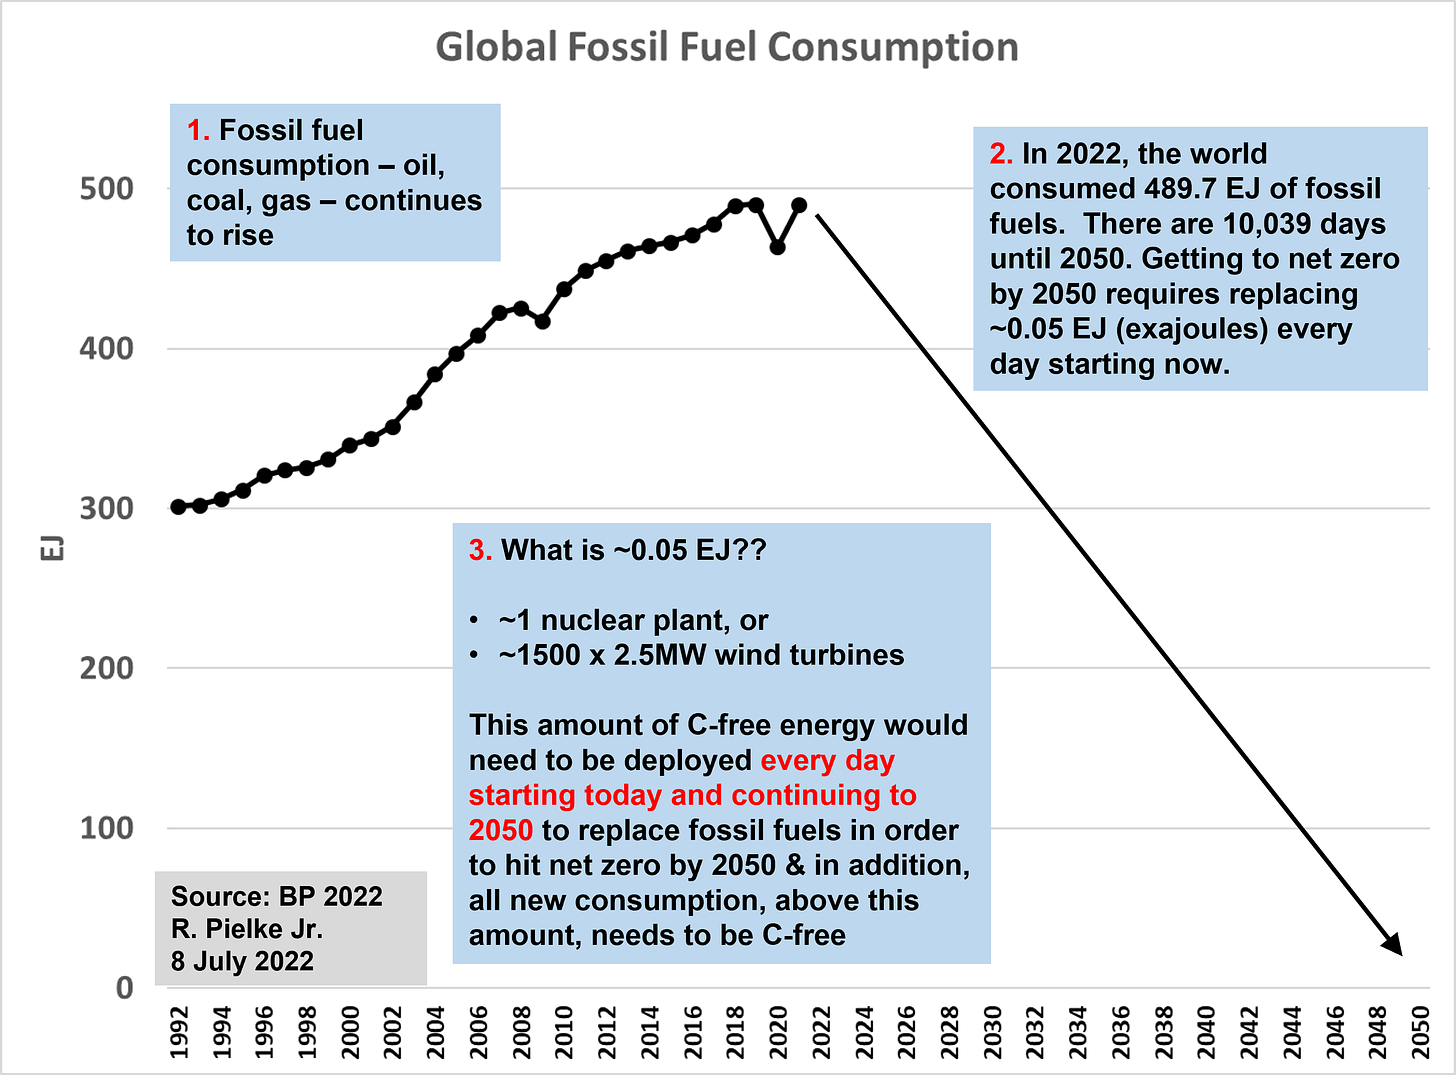
The graph below focuses in on fossil fuel energy consumption. You can see that the reduction in consumption during 2020, due to the pandemic, was almost fully recovered in 2021 as the economy rebounded. Expectations are the 2022 will see a new record high for fossil fuel energy consumption. So long as fossil fuel consumption is increasing, the world is moving away from net-zero targets, no matter what is happening with carbon-free energy supply.
The figure shows that to fully replace fossil fuels will require deployment of about 1 nuclear power plant equivalent of carbon-free energy per day during coming decades. which is about the same as 1,500 wind turbines (2.5MW). This is just a back of the envelope figure — one can vary the assumptions to arrive at half as many nuclear power plant equivalents, or twice as many. It is also important to note that this back-of-the-envelope estimate neglects the current deployment of carbon-free energy supply (which increased by 5.2 EJ in 2021 from the pervious year) as well as the global increase in overall energy consumption (which increased by 31.1 EJ in 2021 from 2020).
I should note that this rate of deployment of carbon-free energy is consistent to what I estimated in The Climate Fix more than a decade ago. That indicates that the magnitude of the challenge of decarbonization has not increased, but nor has it decreased. Climate policy has been treading water.
The graph below offers another perspective on the challenge of transforming the global energy system. The figure shows the annual increase in energy consumption in fossil fuels (black) and carbon-free energy (green).
To get a sense of how the chart would have to look to hit a net-zero target for 2050, imagine the black bars at about negative 20 EJ per year (so similar to 2020) every year to 2050, and the green bars at about positive 30 EJ (similar to fossil fuels in 2021), also for every year to 2050. It is a big challenge.
If you enjoyed this post, please share.
I welcome your comments and suggestions.
Thanks for subscribing!


With all due respect, Roger, from a fellow atmospheric scientist, what is the point of writing "requires the deployment of 1 nuclear power plant equivalent of carbon-free energy per day for decades to come"? I expect this from the more rabid unscientific greens but not from you. Especially given the commitment of China and India to increasing their coal use for decades into the future. Can't we move beyond pointless discussions of the kind you just published and address the realities of evolving energy usage globally, and what it implies for global GHG emissions going forward?
Can you also please write a piece addressing the energy poverty being created in Europe currently, and provide perspective about the draconian measures being forced on lower and middle class citizens and businesses in countries like the Netherlands, parts of Australia and Canada, and many other countries in the west that each account for 0.5-1% or less of global emissions, while China, India and Russia are collectively approaching 50% of total global emissions and two thirds of global coal burning? You would be doing a service to policy makers and the MSM by providing such much needed perspective.
I do appreciate your efforts to bring science and rationality to important climate issues. This article is a rare "miss". Cheers, Arthur
Roger, I hope that you are getting as much from your interacting here as I am.
By the way I am now a paying subscriber.