

Climate Journalism is Broken
Climate Journalism is Broken
A new paper reveals troubling biases


In 2020, scholars published more than 50,000 peer-reviewed papers on climate change in almost 6,000 journals. A new study by Marie-Elodie Perga and colleagues looks at how these papers were covered by news media and reveals some profound biases in coverage of climate. There are still some excellent journalists providing good coverage of climate, of course, but the overall patterns are troubling.
Let’s take a look at the numbers.
Of the 51,230 peer-reviewed papers on climate change published in 2020, Perga and colleagues found that only about 9% of them saw any media coverage, defined as a single mention in the paper’s Altimetric score. About 2%, or ~1,000 papers, saw more than 20 mentions in the media. These “mediatized” papers are the focus of Perga’s paper.
The 2% of papers most covered by the media are disproportionately focused:
at the global and continental scales;
on the end of the 21st century;
on the natural sciences and health;
and come primarily from just 6 journals (3 from Science journals, 2 from Nature and PNAS).
I looked at their dataset and — as we might expect — RCP8.5 features prominently in many of the papers receiving the most media attention in 2020, including 4 of the top 5 most covered papers.
The biases are large. The paper reports that:
Overall, 56% of the top-100 mediatized papers on natural science report rate or magnitude of climate-driven changes at continental or global scales (40% being projections by the end-of-the-century), while those represent only 4% of the random paperset.
Reporting disproportionately deemphasized studies in the social and political sciences, economics, technology, engineering, energy and agriculture — these are all topics related to what might be done on climate change.
The authors conclude that as a result of these biases, news coverage is biased and the public is misinformed:
Thereby, a few articles get a lot of news mentions, limiting the diversity of information to which readers are exposed (Ortega, 2021). The selective sourcing of news media for high-profile journals and strong degree of co-mention in news outlets thereby come with a loss of disciplinary diversity of the research brought to public’s attention, with over-emphasis on natural science and health, while research findings produced on the social, economic, technological and energy-related aspects of climate change are curtailed back through the mediatization process. The selectivity is even found within the dominant natural science. Mediatized scientific publications are selectively concentrated on the worldwide magnitude of the current consequences of climate change, and projected risks by the end of the century for natural Earth components.
The authors hold a position that I do not — that the main purpose of media coverage of climate is to motivate people to act on climate, whatever that means. In my discussions of climate journalism with reporters (those that will speak to me) I often hear a similar view, that the purpose of climate journalism is advocacy for climate as a cause.
Indeed, the authors of the paper view themselves, alongside journalists, as collaborators in using communication to motivate “action”. Here is how they describe their work:
[C]limate communication research builds on social sciences to explore how and to what extent climate change is relayed and framed whilst developing optimized strategies and guidelines for transforming public engagement into actions.
This definition of “climate communication” is evocative of what almost a century ago political scientist Harold Lasswell called, “the management of collective attitudes by the manipulation of significant symbols” — or political propaganda. If the idea that climate journalism is engaged in political propaganda seems uncomfortable, then try instead advocacy journalism.
Although they may look and behave like modern media organizations, they are advocacy groups, and have an explicit agenda; they’re looking for impact. That agenda may coincide with the news, and they may use traditional journalistic techniques to advance it, but in most cases the larger goal of this work is in service of some kind of policy change or other action, and not information or the public record per se.
Climate journalism wasn’t always dominated by an advocacy agenda. More than a decade ago, I along with colleagues Ursula Rick and Max Boykoff evaluated 20 years of media coverage of sea level rise. We found overall media reporting on sea level rise to be highly consistent with the scientific literature and the assessment reports of the Intergovernmental Panel on Climate Change, summarized in the figures below.
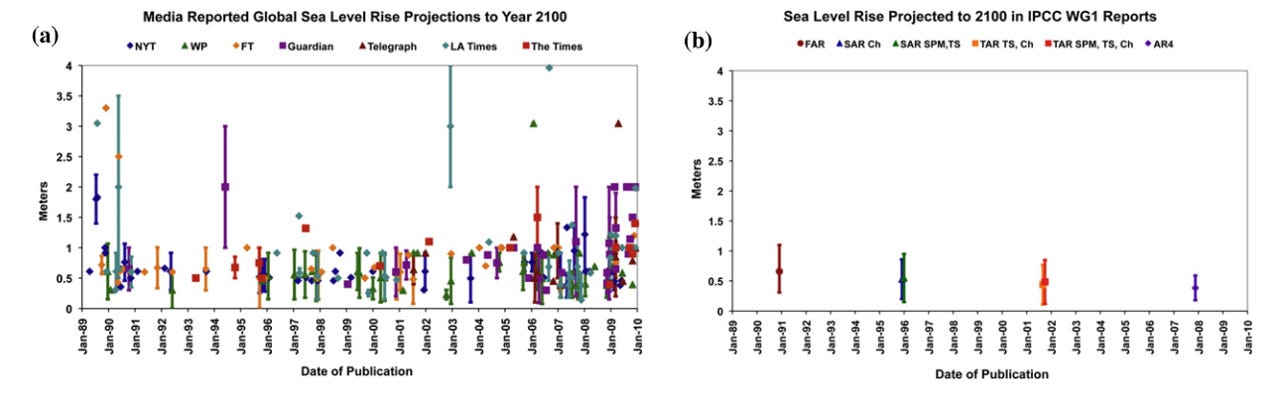
We concluded, “accurate reporting on projections for sea level rise by 2100 demonstrates a bright spot at the interface of climate science and mass media.”
What has changed? I can think of a number of things:
Journalism itself has changed dramatically, with resources for reporting shrinking;
Reporting has shifted emphasis from news to opinion;
Niche reporting tailored to reader interests has increased;
Climate advocacy has increasingly focused on promoting extreme weather as climate change.
All of this favors what we might call reporting from the keyboard on climate, which would favor utilizing press releases from universities that promote studies in the top 6 journals, focused on projections of climate to 2100 at national or global scales, and linked to the event that just happened. Add in an advocacy orientation and we have the current climate beat — The stories, they write themselves.
A further complication, perhaps specific to climate, has been the influence of what has been called “balance as bias.” This idea holds that there is a single “correct” view of climate science, and divergences from this view are biased.
Academics have evaluated media reporting based on whether it reflects the “correct” view (good reporting) or challenges it (flawed reporting). The notion arose out of a perception several decades ago that climate skeptics received too much media attention, and gradually expanded to encompass any views outside a shared, preferred narrative of a group of academics, journalists and fellow travelers promoting climate advocacy.
Of course, science doesn’t work like this and it is entirely appropriate for experts to hold divergent views — in fact, that is how science gets done. The consequence however is that climate reporting typically includes no differences of opinion, rather, only voices friendly to the preferred narrative.
The “balance as bias” thesis has been wildly successful at eliminating certain voices from the legacy media. Ironically, the success of “balance as bias” thesis has itself contributed to profound biases in media reporting, and arguably allowed advocacy journalism on climate to proliferate unchecked.
Since 2020, the year explored in the data above, news media biases have gotten worse. Perga and colleagues report that in 2021 a non-peer reviewed pre-print asserting the “virtual impossibility” of the Pacific Northwest heatwave received 8 times the media coverage of the most-covered peer-reviewed paper of 2020. Climate science reporting apparently doesn’t even need science.
Make no mistake, there are excellent reporters out there doing good journalism on climate. For the average reader, however, telling the difference between biased or advocacy journalism to promote a narrative and reporting that accurately reflects the state of climate science and policy is almost impossible.
I welcome your comments. I’m blocked on Twitter by a number of reporters on the climate beat, so please share. Please click on that little heart at the top of this post and ReStack. I’d especially welcome the views of journalists on the climate beat on this post, which I am happy to publish. At THB, balance is not bias.
Rogers writes "I looked at their dataset and — as we might expect — RCP8.5 features prominently in many of the papers receiving the most media attention in 2020".
Can Roger or someone else can provide specific examples of the mainstream climate press basing their apocalyptic articles specifically on RCP8.5? I suspect they do, but when I try to explain to people why they should be skeptical about such climate predictions, it would be helpful if I could point out that these articles are based on scenarios that even the IPCC scientists find highly unlikely.
http://m4.emails.telegraph.co.uk/nl/jsp/m.jsp?c=%40nd81CmNevoUsKUCqx9zLwGXsavHR8lVGqHu6EjwNNkoGgXd%2BbCk9KvfTcRm7VDcuIET1ne88hYr1N8FOJRvRZA%3D%3D&WT.mc_id=e_DM168758&WT.tsrc=email&etype=Edi_EIn_New&utmsource=email&utm_medium=Edi_EIn_New20230627&utm_campaign=DM168758
Perhaps a better standard of climate journalism from an economic perspective noting its political effects. It requires subscription for full access.