A new peer-reviewed paper out this week by Alimonti and Mariani asks whether global disasters have increased. Their answer is that they have not (and if the name sounds familiar, it is the same Alimonti whose paper is being improperly retracted — more fresh info on that in the coming days).
As I read their paper today I noticed that the time series they reported from the EM-DAT database looked a bit different than that I had last explored and presented here at THB late last year. So today I downloaded the most recent data from EM-DAT, and indeed there has been some changes to the most recent three years, presumably due to late entries into the database (however I will enquire as all post-hoc dataset updates should be documented). EM-DAT has been funded since the late 1990s by the U.S. Agency for International Development.
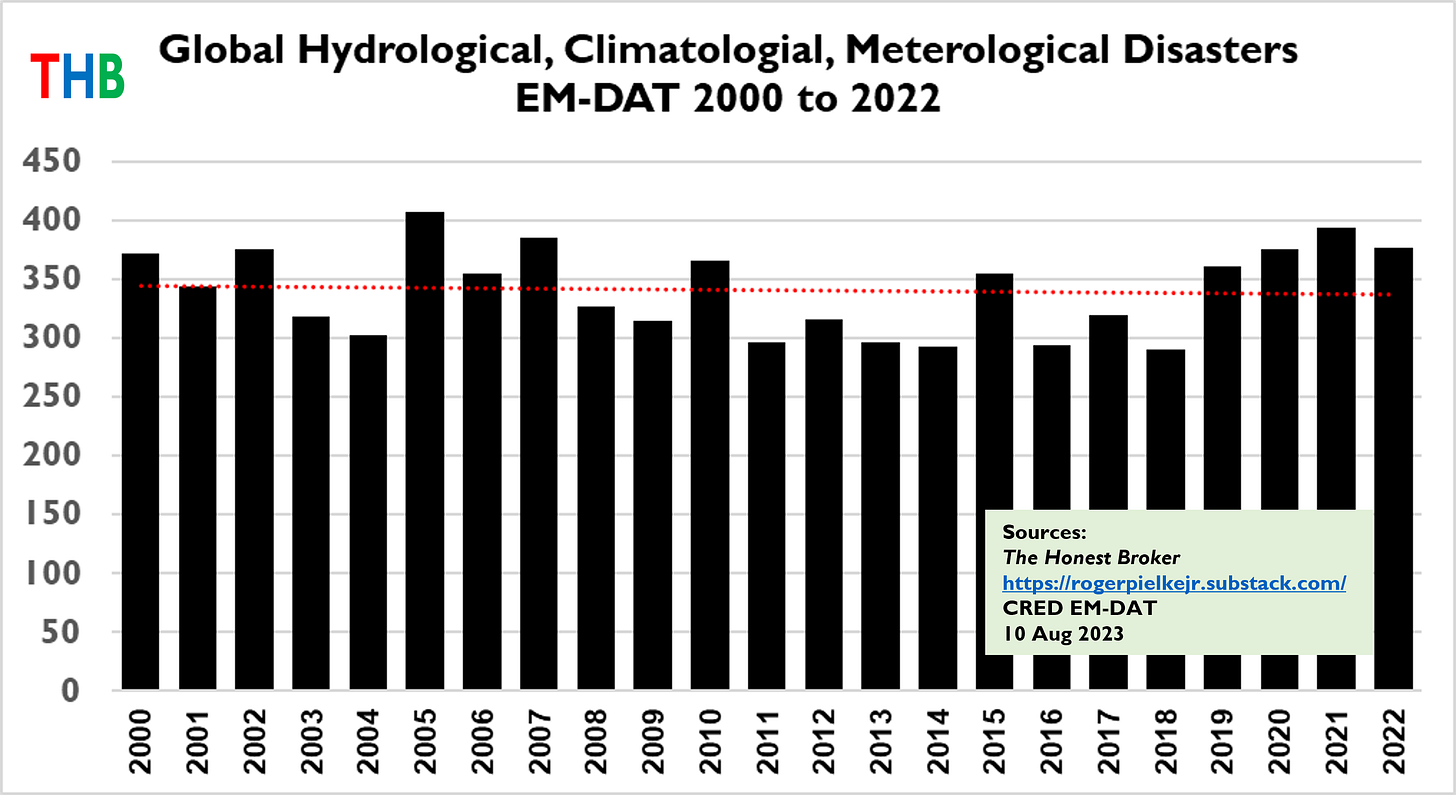
Below is the updated time series of global hydrological, climatological and meteorological disasters in the EM-DAT database, along with the linear trend, over the period 2000 to 2022.
You can see that there is no upwards trend. This lack of trend has not been reported by anyone in the legacy media (and I would be happy to be corrected). However, the completely false notion that global weather and climate disasters have increased and will continue to increase is commonly reported in the legacy media, buoyed by the promotion of false information by organizations that include the United Nations. In 2020 the U.N. claimed falsely of a “staggering rise in climate-related disasters over the last twenty years.”
Based on false claims such as this, Alimonti and Mariani are “concerned about the misrepresentation of the natural disaster trend because such claims have been uncritically broadcast by many different media.” Indeed.
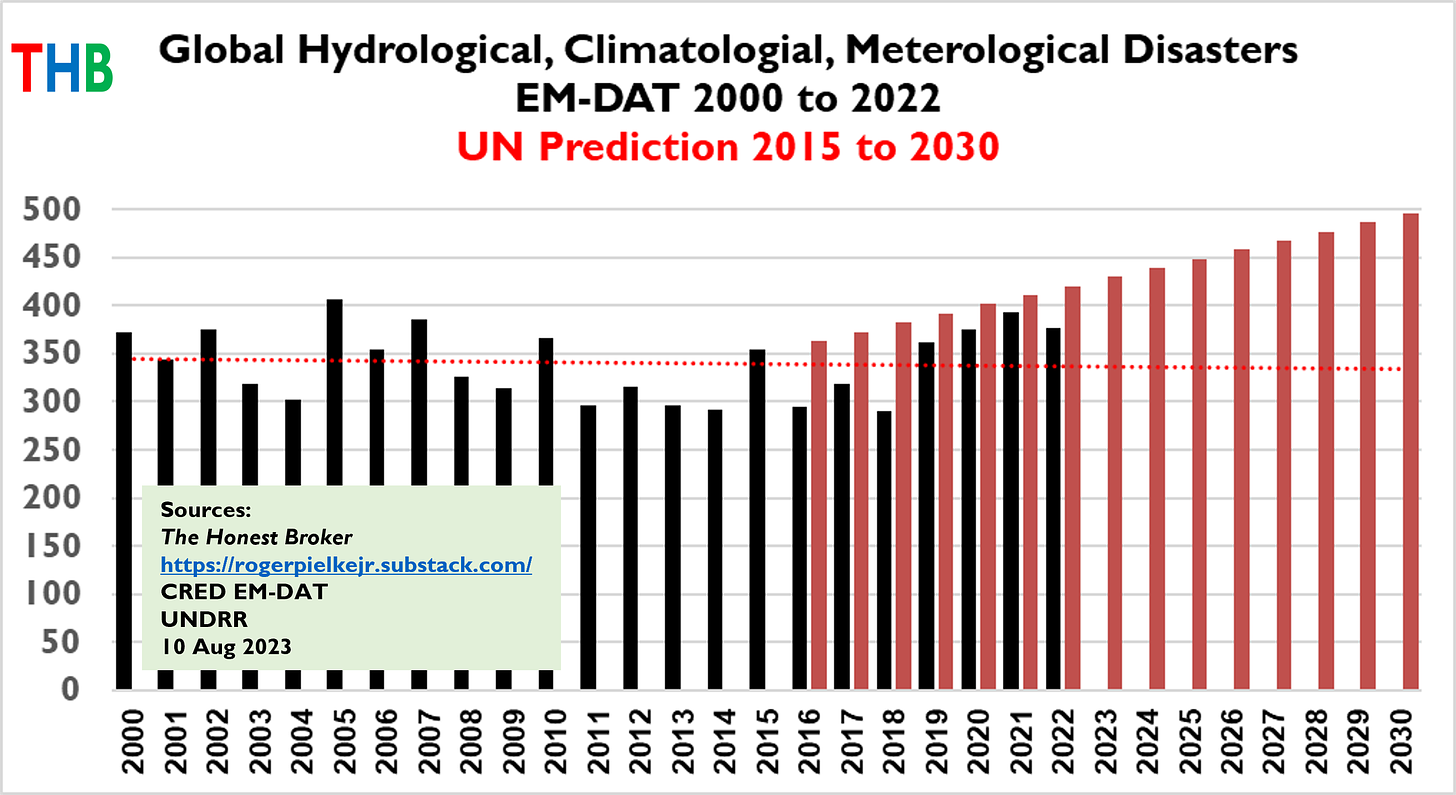
The U.N. forecasts a 40% increase in disasters from 2015 to 2030, as shown below, based on extending a linear trend applied to the EM-DAT dataset from 1970. We know that this methodology is flawed simply because EM-DAT explains clearly that the increase in disasters in its database to 2000 is due to better reporting, and not changes in underlying counts of actual disasters.

We can overlay the UN prediction on the data from 2000 to 2022 and see how the U.N. prediction is faring so far — that overlay is shown below.
There will no doubt be many eyes on the EM-DAT database in coming years to ensure data quality, methodological consistency, and to identify any biases from continued improvement in reporting of disasters. Regardless what happens with trends in disaster counts, it is absolutely essential to remember that if you are looking for a signal of changes in climate — always look directly at weather and climate data, not data on economic or human impacts.
Thanks for reading! I welcome comments, questions and requests. THB is made possible thanks to your support. If you are a longtime subscriber and value the content, please consider upgrading your subscription. If you are new here, welcome — I invite you to stick around with a subscription at any level that makes sense for you. Knowing what is what these days where science meets politics is incredibly difficult, even for experts. My hope is that THB contributes in some small way to helping us together to identify signal in all the noise. Remember, honest brokering is a group exercise!


On David Blackmon’s Substack the other day he brings out that the Hunga Tonga-Hunga Ha’apai undersea volcano last year blew 146 trillion grams of water into the upper atmosphere. NASA JPL was estimating that it may cause warming of as much as 1.5 C for 2 to 3 years any many parts of the globe. And cooling in others. That is one volcano, albeit a large one.
Within the ring of fire it is estimated that there are millions of hydrothermal vents in subduction zones around the planet. James E. Kamis has developed a theory called Plate climatology. Heat flux from the mantle has been completely ignored in climate science but it can explain many climate phenomenon. He just published a book last year. “Geological Impacts on Climate”. As a practicing geologist for the past 45 years it really rang a bell for me. It is a fascinating read. The theory is that heat flux from the mantle through subduction trenches and mid sea rises contributes greatly to warming the oceans from below.
Subduction trenches such as the Marianas Trench are the thinnest crust on the planet. With trillions of gallons of water subducted into hot rock. El Niño, if you will notice starts at a single source point every time. It is cyclical but not consistent, much like other volcanic features such as geysers and subsea hydrothermal vents. Temperature profiles of El Niño show warmer waters below. Climatologists struggle with how heat is stored in deep ocean water. It is not from the atmosphere, heat comes from below.
El Niño in his theory is the direct result of volcanic and hydrothermal activity above the Marianas subduction zone east of Papua Nw Guinea.
Techtonic features below Western Antarctic shelf with dozens of active under ice volcanoes has a heat flux 10 times the heat flux in Eastern Antarctica, explaining why all the ice loss in Antarctica is from the Western Shelf while Eastern Antarctica remains stable.
Water in the Bering sea are warmed by volcanic activity in the Alaskan peninsula, another subduction zone and under sea volcanoes off the coast of northwestern Canada. Currents from the Bering sea move to the Arctic through the Bering straight contributing to melting sea ice distribution in the Arctic.
Same in Greenland. Heat flux from crust at one time overlaying a mantle plume, now under Iceland still has a heat flux 5 times higher than southern Greenland. There, as in the Antarctic, the ice is melting from below. Nowhere does any of this show up in climate models.
There is little to no research being done on this theory. The theory seems sound but more research needs to be done. He derived the theory from basic geological and geophysical studies. Just as it took Plate Tectonics 70 years to become mainstream, hope it doesn’t take that long for this theory to be tested.
I very much enjoy your work. A question though -- can you help me understand how events like the current Canadian wildfires fit into the equation? They are obviously a serious challenge, and equally obviously helped along by the weather trends this year. We should be looking at mitigation strategies, of course, but there is no direct economic impact reported that I am aware of, other than on some smaller communities that experience loss, and the health impacts that follow on from the smoke generated which will be hard to isolate and quantify. In Canada, these are Crown lands, and I doubt that there is any insurance claim for the loss of a valuable asset. Is this a type of under-reporting that we should be aware of?